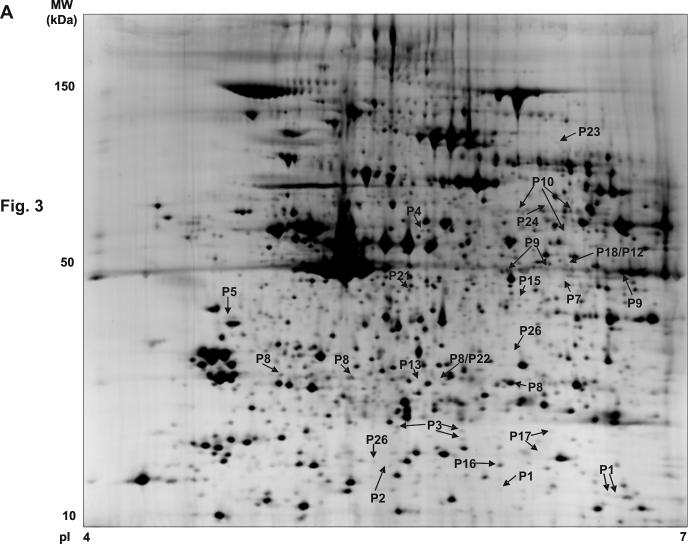
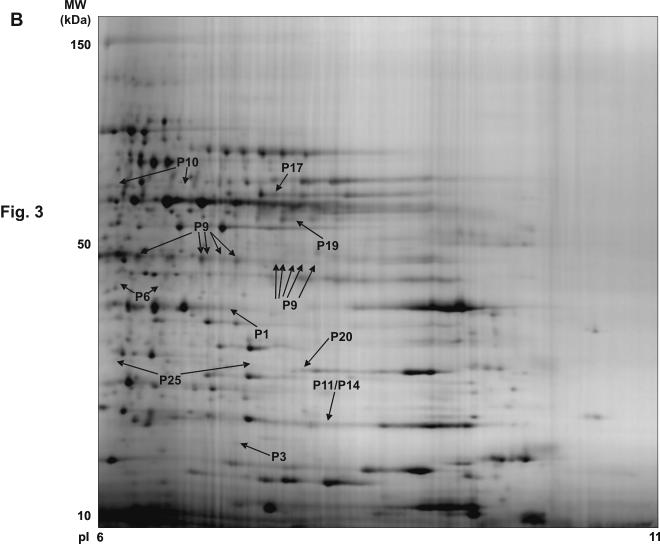
Figure 3.
Synthetic 2-DE gel images representing all protein features present in the basal versus CRP analysis. (A) pI 4-7 range. (B) pI 6-11 range. The figure shows the location on the 2D gels of the features corresponding to the signaling proteins successfully identified in the analysis. The synthetic images represent groups of eight gels (four basal and four CRP) for the two pH ranges. The original gels were used for the differential analysis. P1, CLP-36; P2, ADAP; P3, RGS10; P4, Dok-2; P5, SKAP-HOM; P6, Gads; P7, MHC class I HLA-A protein; P8, Heat Shock 27 kDa protein; P9, Pleckstrin; P10, Src; P11, p21-Rac1; P12, Annexin VII; P13, Grb2; P14, RKIP; P15, Crk-like protein; P16, Rho GDP-dissociation inhibitor 2; P17, adenylyl cyclase-associated protein 1; P18, MEK1; P19, ILK-1; P20, Ras suppressor protein 1; P21, p38α MAP kinase; P22, OSF1; P23, MacGAP; P24, Dok-1; P25, RGS18; P26, Drebrin F. More information on all these proteins can be obtained from the Supplementary Table 2.


