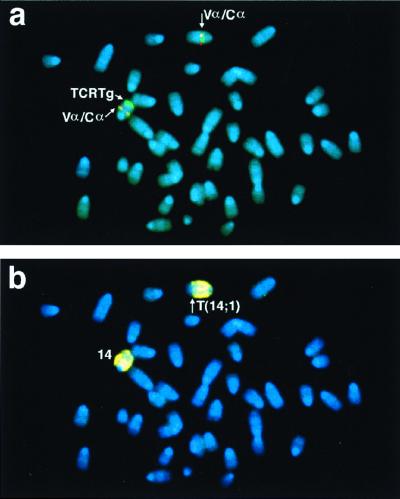
Figure 3.
FISH analysis of the Tcr α/δ locus in HyTcrTg+Rag2−/−Atm−/− thymic lymphoma 3013. (a) FISH was performed on tumor 3013 with BAC probes to variable region α (Vα) and constant region α (Cα) in the Tcr α/δ locus. The Vα signals are shown in green and the Cα signals are shown in red. Chromosomes are counterstained with 4′,6-diamidino-2-phenylindole (blue). The signals are colocalized, indicating that the Tcr α/δ locus is not disrupted. The extra green signal on one chromosome 14 is due to integration of the (prespliced) HyTcr transgene (Tg) at that site. (b) The same metaphase as in a labeled with a chromosome 14 painting probe (yellow), confirming the chromosomal location of the Tcr α/δ BAC probes. The chromosome 14 breakpoint in the T(14;1) (indicated by the arrow) is not within the Tcr α/δ locus.

