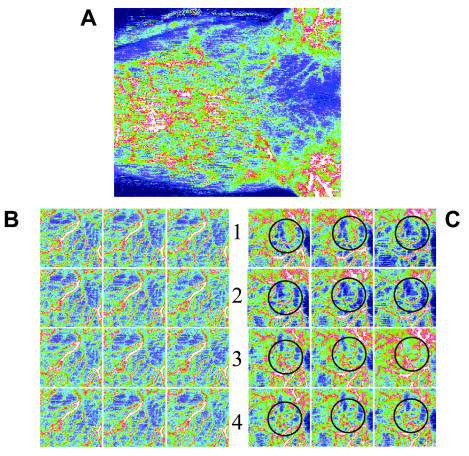
Figure 6.
(A) Overview of superficial perfusion of the rodent epigastric area. (B) Control group with no alterations in perfusion (C) NO-Hb Group with increase in local perfusion during laser irradiation. Circles indicate the region where the maximal changes were observed. Quantification, however, was performed for whole region displayed in the figures. 1st column—Background, 2nd column—Infusion of NO-Hb, 3rd column—Irradiation of epigastric artery, 4th column—After irradiation period.

