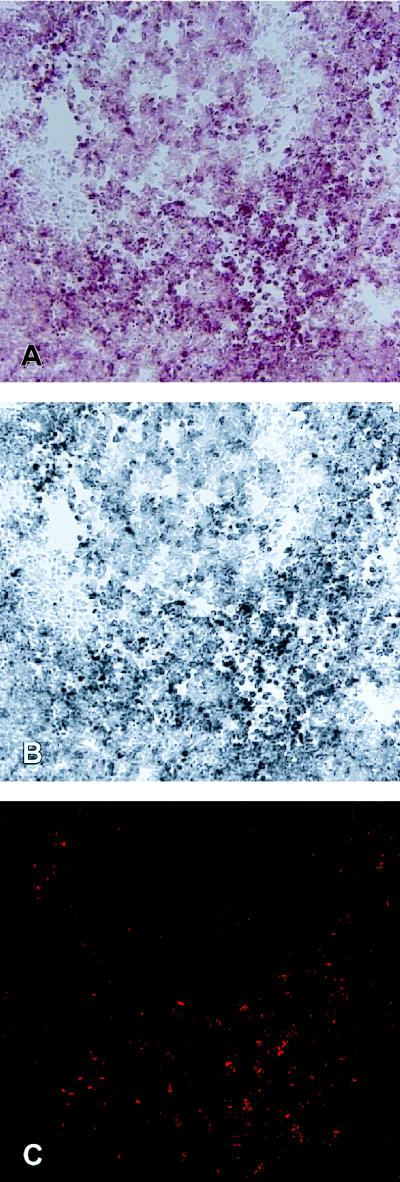
Figure 1.
Quantitative image analysis of CD4+ T cells in lymphoid tissue. (A and B) Color and black and white video images of CD4+ T cells in a tissue section stained immunohistochemically with antibody to CD4 and vector red substrate. (C) The darker stained cells in B are identified with a red overlay. The number of CD4+ T cells in the field is computed automatically from the measured area of the objects highlighted in red and the standard area of a cell.

