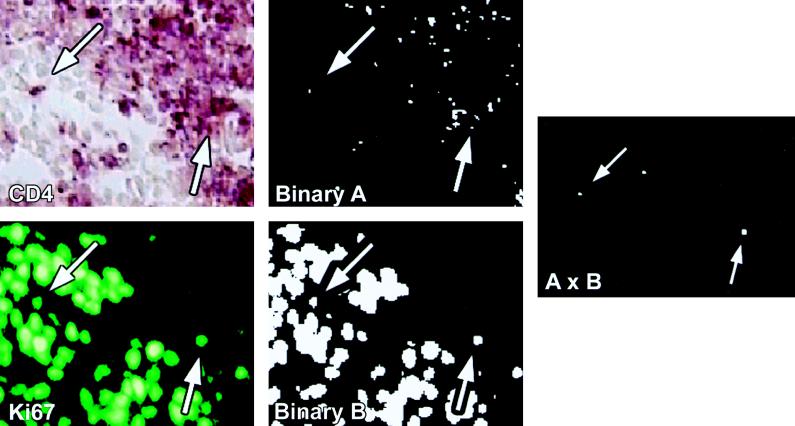
Figure 2.
Quantitative image analysis of doubly labeled CD4+ T cells in LT. The upper panels display the color images of immunohistochemically stained CD4+ T cells and the binary derivative (A) of the digitized information. All cells with a binary value of 1 are white. The arrow points to two CD4+ T cells that are Ki67+. In the lower panels, proliferating cells, mainly the B lymphocytes concentrated in the germinal center, have been identified by staining with antibodies to Ki67 and fluoresceinated secondary antibody. Positive cells are green in the color image and white in the binary derivative image (B). The arrow again points to two double-positive cells, identified in the panel at the right by multiplying the binary derivatives A × B to locate and count the CD4+ Ki67+ cells.

