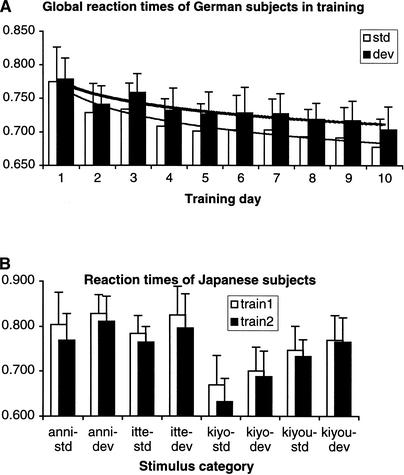
Figure 1.
(a) Grand averaged RTs and SEM across German subjects for each training session. A constant decrease approximated by a logarithmic trend (thick line for deviants, thin line for standards) occurs from training day 1 to 10. (b) Grand averaged RTs and SEM of Japanese subjects for each stimulus condition.

