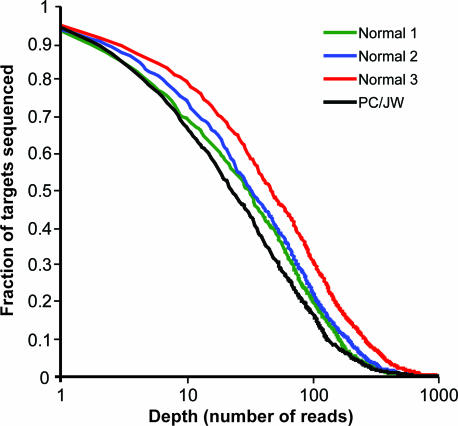
Fig. 2.
Sequencing depth. A normal sample, circularized and amplified in triplicate reactions, and a cancer cell line sample, PC/JW, were sequenced in one 454-experiment. The x axis shows number of reads (n), and the y axis shows the fraction of the target region with a sequencing depth of n or more.

