
Figure 3.
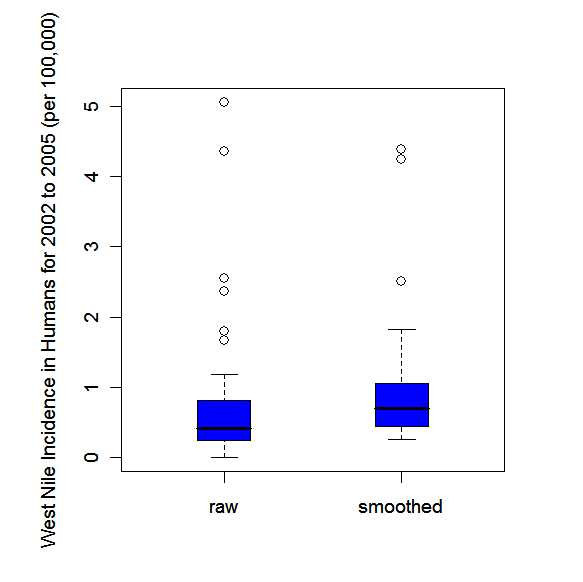
Parallel box plots for the raw annual human incidence rates of WNv disease per 100,000 population (raw) and the corresponding empirical Bayesian smoothed estimates for the 30 public health units of southern Ontario, 2002–2005.
Official websites use .gov
A
.gov website belongs to an official
government organization in the United States.
Secure .gov websites use HTTPS
A lock (
) or https:// means you've safely
connected to the .gov website. Share sensitive
information only on official, secure websites.
Parallel box plots for the raw annual human incidence rates of WNv disease per 100,000 population (raw) and the corresponding empirical Bayesian smoothed estimates for the 30 public health units of southern Ontario, 2002–2005.