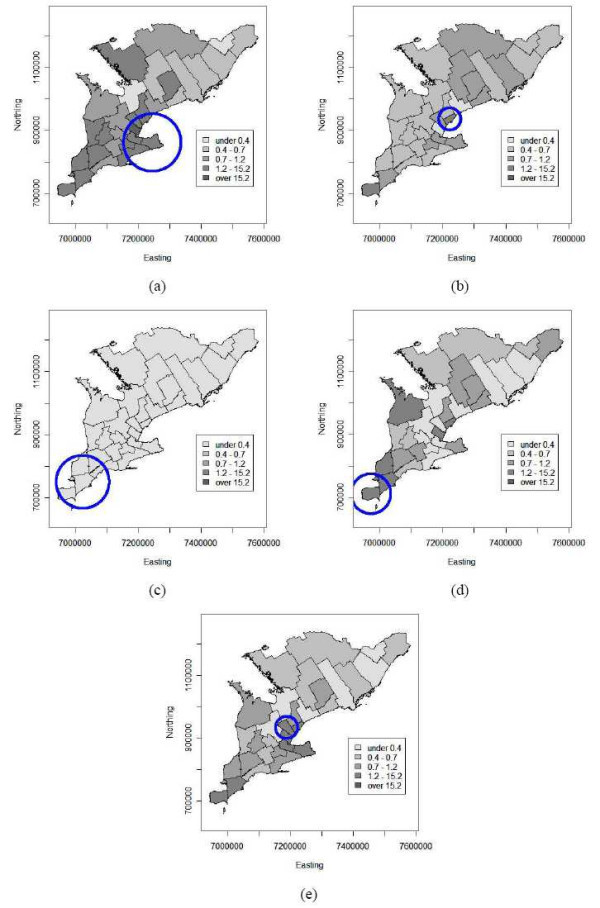
Figure 5.

Choropleth maps of empirical Bayesian smoothed annual human risk estimates of WNv disease per 100,000 population for the 30 public health units of southern Ontario (a) 2002, (b) 2003, (c) 2004, (d) 2005 and (e) on average over 2002 to 2005. The circles indicate disease cluster locations as identified by the spatial scan statistic. Coordinates are in the Cartesian coordinate system (in meters).
