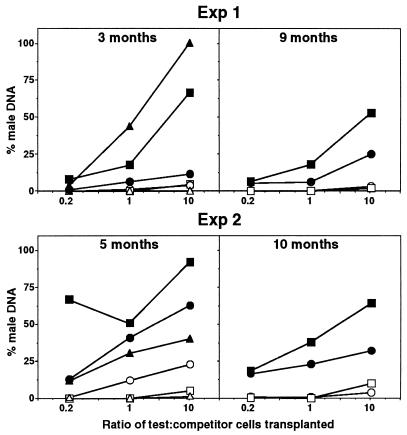
Figure 3.
Inferior competitive long-term repopulating capacity of mpl−/− stem cells in primary recipients. Contribution of transplanted bone marrow cells to the bone marrow (▵, ▴), spleen (○, •), and thymus (□, ▪) of primary recipients that received 2 × 10⁵ wild-type female competitor bone marrow cells mixed with 5 × 10⁴, 2 × 10⁵, or 2 × 10⁶ test cells (test/competitor ratios 0.2, 1, and 10) from male mpl−/− (open symbols) or wild-type (filled symbols) mice. Each point represents the mean percentage of male DNA in the organs of 2–3 recipient mice determined by Southern blot analysis. Experiments 1 and 2 involved transplantation of bone marrow cells from independent wild-type and mpl−/− donor mice, the recipients of which were analyzed at 3 and 9 months and 5 and 10 months, respectively.

