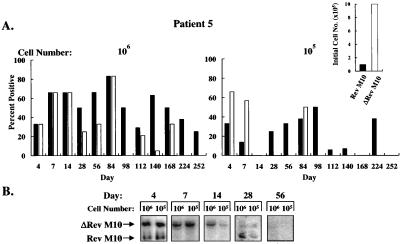
Figure 3.
Prolonged survival and kinetics of Rev M10-transduced cells in patient 5. (A) After infusion of genetically modified CD4+ cells, peripheral blood samples were collected, PBMCs were isolated, 106 (Left) or 105 (Right) cells were lysed, and DNA analysis was performed for detection of Rev M10 or ΔRev M10 cells. Multiple limiting dilution and competitive DNA PCR analyses were performed at each time point. The bars represent the average of these analyses. (Inset) The relative percentage of the genetically modified cells in the PBMCs at the time of infusion, determined by DNA PCR. For the Rev M10 vector, 1% of 2.2 × 10¹⁰ cells were transduced, and for ΔRev M10, 10% of 2.2 × 10¹⁰ cells were genetically modified and infused. (B) A time course of RNA expression in patient 5 of cells stimulated with anti-CD3 and anti-CD28 antibodies by RT-PCR analysis is shown. Total RNA was extracted from 106 and 105 PBLs and used in the RT-PCR.

