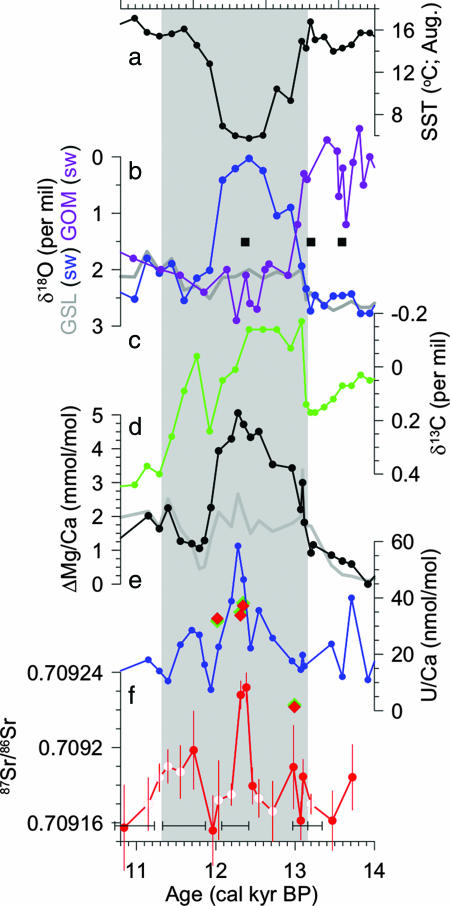
Fig. 2.
Geochemical time series (in calibrated radiocarbon kyr B.P.) for the Younger Dryas interval. (a) Dinoflagellate cyst SST reconstruction (HU90031-044) (9). (b) Planktonic [N. pachyderma (s)] δ18O (gray) (11) and of seawater (blue) for the St. Lawrence (SL) (HU90031-044); and planktonic (Globigerinoides ruber) δ18Oseawater record from the Gulf of Mexico (GOM) (purple) (31). Black squares denote the reported calibrated age control (31). (c) Planktonic [N. pachyderma (s)] δ13C record (green) from the St. Lawrence (HU90031-044) (courtesy of C. Hillaire-Marcel). (d) Mg/Ca (gray) and ΔMg/Ca (black) of G. bulloides (HU90031-044). (e) U/Ca of G. bulloides (blue from HU90031-044 and green from HU90031-047) and N. pachyderma (s) (red from HU90031-047). The offset in U/Ca between 044 and 047 before the Younger Dryas reflects the different proximity of the cores to the riverine end-member. (f) Sr isotopes of G. bulloides (HU90031-044). White symbols with red outline represent thermal ionization MS measurements; red symbols with white outline represent multicollector inductively coupled plasma MS measurements. The gray bar denotes the time of eastward routing as inferred from our geochemical proxies of routing. Horizontal bars at the bottom indicate calibrated radiocarbon age control for core HU90031-044.

