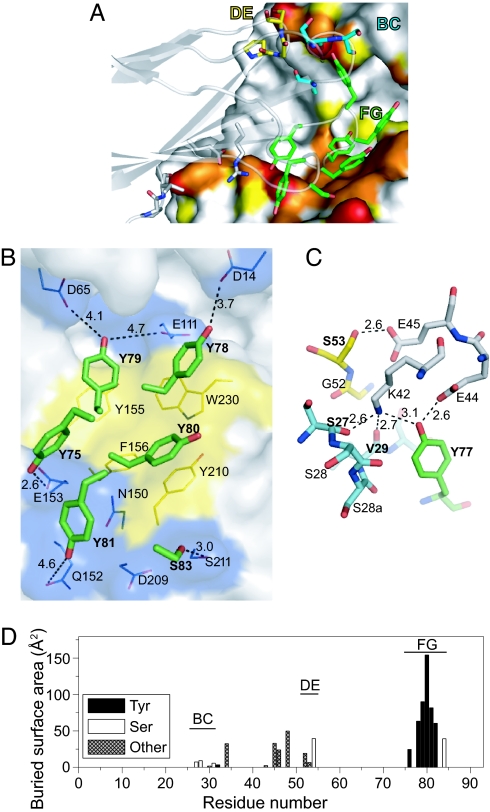
Fig. 4.
The binding interface of the MBP-74 monobody and MBP. (A) The monobody paratope residues are shown as stick models, and the MBP epitope surface is shown in the same manner as in Fig. 3D. The carbon atoms of BC, DE, and FG loop residues of the monobody are in cyan, yellow, and green, respectively. The oxygen and nitrogen atoms are shown in red and blue, respectively. The monobody backbone is also shown as a transparent cartoon model. (B) Interactions between the monobody FG loop residues (stick models) and the MBP bottom lobe epitope (shown as surfaces). The surfaces of aromatic residues are shown in yellow. Potential polar interactions for the hydroxyl oxygen atom of the paratope Tyr residues are shown as dashed lines with their distances. The monobody residues are indicated in bold. (C) The interactions in the top lobe epitope. MBP residues are drawn with carbon atoms in gray. The carbon atoms of BC, DE, and FG loop residues of the monobody are in cyan, yellow, and green, respectively. (D) The buried surface areas of the monobody residues. Only those for the binding complex are shown.

