Fig. 2.
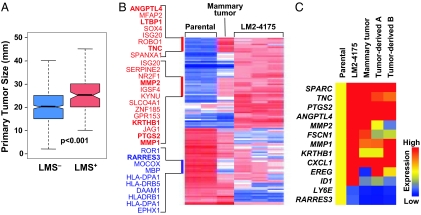
LMS+ primary tumors are larger and can be experimentally selected for during primary tumor growth. (A) A box-and-whisker plot comparing the size distributions for LMS− and LMS+ primary tumors in the NKI-295/EMC-344 cohort. Shown are the medians, 25th and 75th percent quartiles, and 1.5 times the interquartile range. P values for the box plots were calculated by using a Wilcoxon rank sum test. (B) Transcriptomic microarray profiling was performed on parental MDA-MB-231 cells, the LMS+ in vivo selected lung metastatic LM2 subpopulation (LM2–4175) (15), and cells derived from xenografted parental MDA-MB-231 mouse mammary fat pad tumors. Mammary tumor denotes a sample from which in vivo mRNA expression was assessed directly from a fresh frozen mouse mammary tumor. The heatmap corresponds to relative gene expression levels for 95 previously identified lung metastasis genes (113 probe sets), with red being high and blue indicating low expression. Gene labels are provided for gene clusters of interest due to partial selection during outgrowth of a parental MDA-MB-231 mammary tumor. Genes highlighted in bold are functionally validated mediators of lung metastasis or are included in the 18-gene LMS. (C) Confirmation of microarray-based gene expression levels by using quantitative RT-PCR analysis. Expression values for representative lung metastasis genes were normalized to parental MDA-MB-231 expression levels and displayed graphically as a heatmap. Tumor-derived A and B represent in vitro analyses of independent isolates of cells purified from dissociated MDA-MB-231 mammary tumors.

