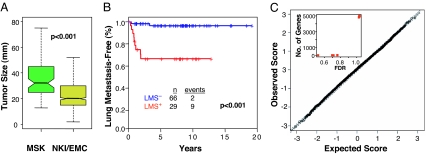
Fig. 5.
Tumor size influences the probability of lung metastasis for LMS+ tumors in a manner that is independent of discernable uniform changes in gene expression. (A) Box-and-whisker plot comparing tumor size distributions between the MSK and NKI-295/EMC-344 cohorts. The P value was calculated by using a Wilcoxon rank sum test. (B) Lung metastasis-free survival for patients with LMS+ tumors (red) compared with LMS− tumors (blue) in the NKI-295/EMC-344 cohort after excluding patients with a tumor size <3 cm (the approximate median size for the MSK cohort). P value was calculated by using the log-rank test. (C) Gene expression changes in tumors <2 cm in size and tumors ≥2 cm in size among LMS+ primaries from the NKI-295 cohort were compared by using SAM. Shown is a Q–Q plot with the Δ value corresponding to a median FDR of 10% marked by the dashed line. Genes that lie outside of this dashed line are deemed significant. In this case, no genes are determined to be significant at an FDR of 10%. The inset shows the number of significant genes as a function of increasing FDR.

