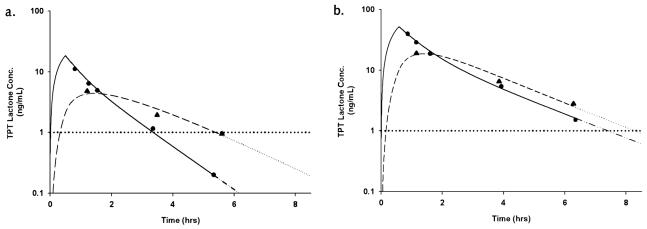
Fig. 2.
Topotecan lactone concentration-versus-time plot. a. Before dosage adjustment (AUC = 30 ng/ml-h and vCSF exposure duration [---] ~ 4.8 h). b. After dosage adjustment (AUC = 135 ng/ml-h and vCSF exposure duration [---] > 8 h). Observed plasma (•) and CSF (▴) concentrations are plotted. The solid line represents best-fit plasma curve to last measured data point, and extrapolation is indicated by a dashed and dotted line. The dashed line represents best-fit vCSF curve to last measured data point, with extrapolation indicated by a dotted line. In both cases, extrapolation was achieved by simulation of concentration–time data using the estimated compartmental pharmacokinetic parameters. The bold horizontal dotted line represents the desired vCSF exposure duration of 1 ng/ml.

