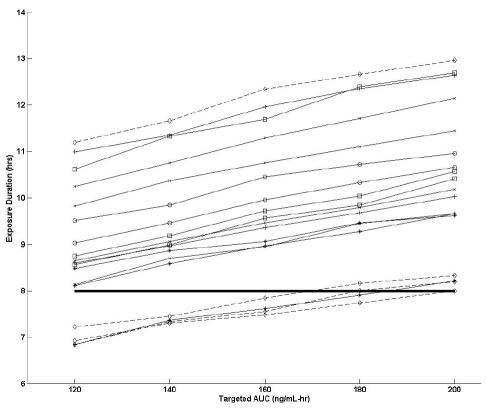
Fig. 3.
Exposure duration versus targeted area under the concentration–time curve (AUC). Each line represents an individual study, and each symbol represents an individual patient. The dashed lines represent the studies that were removed in the subset analysis (patient 1). The bold horizontal line represents the EDT of 1 ng/ml for 8 h.

