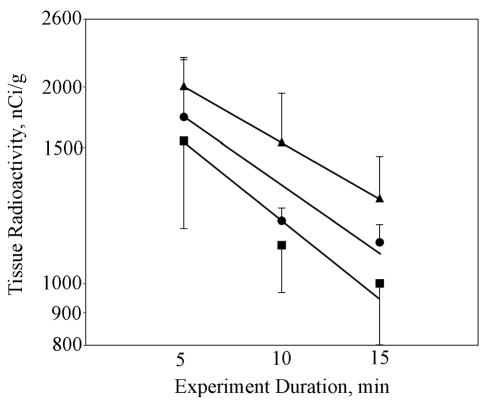
Fig. 2.
Tissue radioactivity values versus time in three treatment groups. Shown are the data (±SD) and linear least-squares fits for the hypothermia group (r2 = 0.9337) (▪), dexamethasone group (r2 = 0.8741) (•), and combined hypothermia-dexamethasone group (r2 = 1.0) (▴). Efflux half-times were calculated from an exponential fit to the data.

