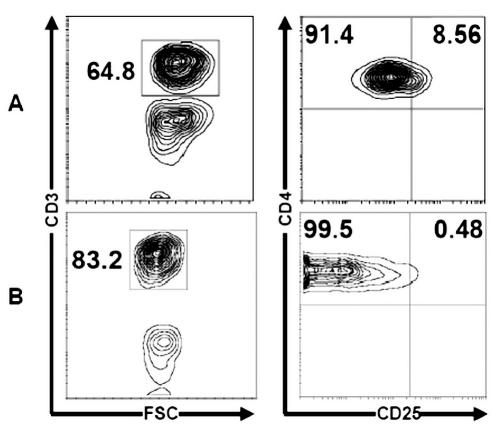
Fig. 3.
Analysis of CD4+CD25+ T cells in peripheral blood. Autologous blood from glioma patient (A) versus control blood (B). Representative FACS plots are shown demonstrating CD3 (I) and CD4 and CD25 (II) staining. The frequency of Tr cells in the glioma patient’s blood was increased when compared with the frequency observed in control blood (8.56% ± 2.46% [range, 6.4%–12.4%] vs. 0.48 ± 0.13% [range, 0.26%–0.7%]; P < 0.05). Cumulative results of flow cytometric analyses of regulatory T cells are shown as the percentage of total CD4+ or CD3+ T cells.

