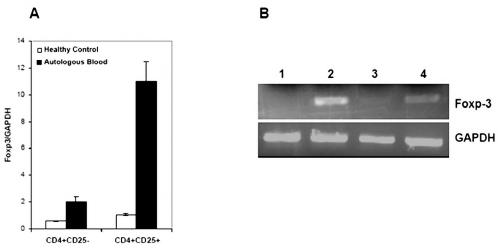
Fig. 5.
Level of FOXP3 expression in CD4+ T cell subsets. FOXP3 quantification by real-time PCR (A) and semiquantitative PCR (B) in CD4+ T cells. The real-time PCR data shows that the level of FOXP3 mRNA was fivefold to sixfold higher in CD4+CD25+ cells (A). This difference was significant with respect to control (P < 0.05). Lines 1 and 2 consisted of CD4+CD25− and CD4+CD25+ sorted from autologous blood, and lines 3 and 4 consisted of CD4+CD25− and CD4+CD25+ sorted from control blood donor. CD4+CD25− and CD4+CD25+ were sorted separately from PBMCs with more than 97% purity.

