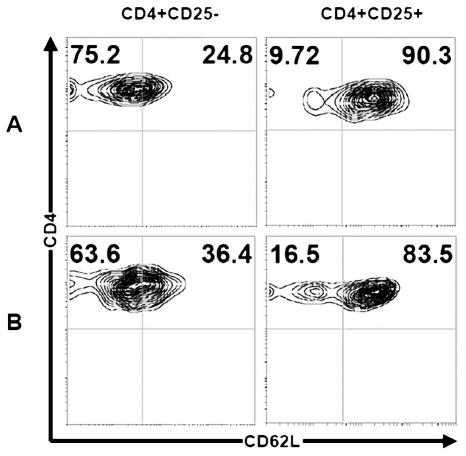
Fig. 6.
Regulatory T cells show suppressor phenotype. The expression of CD62L after gating of CD4+CD25+ or CD4+CD25− cells in autologous blood of patients (A) and control blood (B). The left panels of rows A and B show, respectively, an expansion of CD25−CD62L− subsets in glioma patient (mean, 75.2% ± 4.03%; range, 70%–81%) compared to control blood (mean, 63.6% ± 3.74%; range, 58%–69%) (P < 0.01). The same expansion of CD25+CD62L+ was seen in glioma patients (mean, 90.3% ± 2.83%; range, 88%–97%) versus controls (mean, 83.5% ± 4.34%; range, 77%–88%) (P < 0.01). The cells were stained with three-color fluorescence and analyzed by fluorescent flow cytometry.

