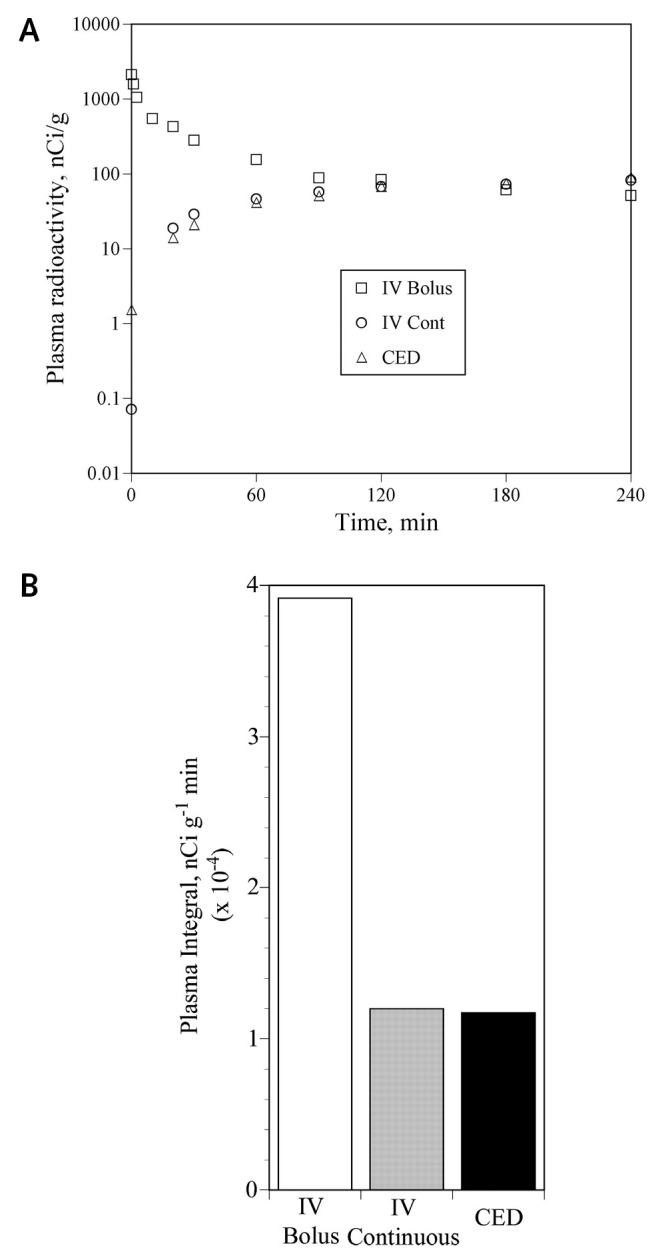
Fig. 1.

Plasma radioactivity values. A. Mean values from the 4-h animals in the IV-B (open squares), IV-C infusion (open circles), and convection-enhanced delivery (CED) (open triangles). Note that the y-axis is logarithmic. As expected, the plasma values after IV-B show a biexponential decay, while those from the IV-C and CED groups rise gradually and plateau at about 90 to 120 min. The plasma values from the CED group lag slightly behind those of the continuous infusion group. Error bars are not shown; in most cases the error bars (± SD) were within the plotted symbol of the mean and, when included, obscured the plot of the mean values. B. Integrated plasma activity (nCi g−1 min) for each of the 3 groups.
