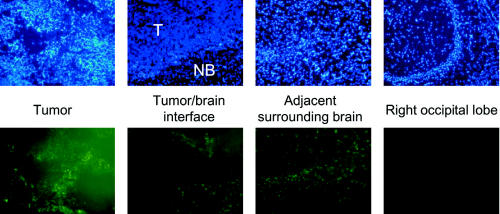
Fig. 4.
Distribution of fluorescein-labeled GRN163 into brain tumor and normal brain in athymic rats on day 3 after completion of a 7-day infusion at the same relative depth in each rat brain. Upper panels show DAPI fluorescence, and lower panels show FITC fluorescence. In the tumor/brain interface panels, the tumor is at the top of each image. All magnifications are 10×.

