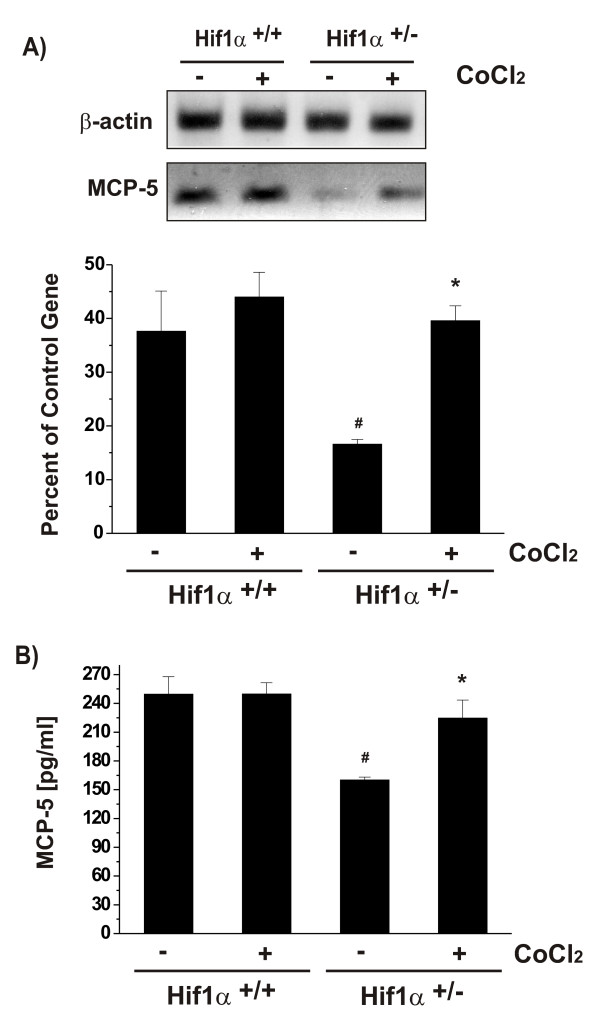
Figure 4.
Effects of CoCl2 treatment on MCP-5 expression in mouse HIF-1α+/- and HIF-1α+/+ astrocytes. The cells were incubated in the presence or absence of 125 μM CoCl2 for 6 hr. MCP-5 expression at the mRNA and protein levels was determined by RT-PCR (A) and ELISA (B), respectively. Each bar represents the mean ± SD of relative density/volumes of the bands on film negatives from least three experiments or three ELISA assays. Asterisks and number signs indicate significant difference compared to relevant controls (p < 0.01; one-way ANOVA, followed by multiple comparisons among means).

