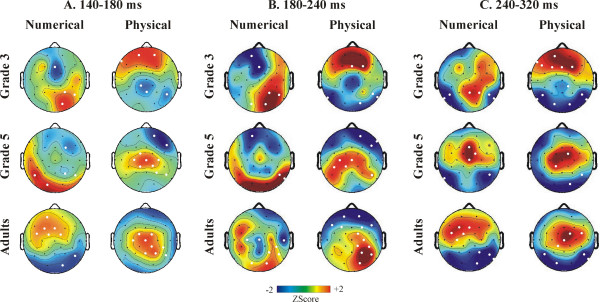
Figure 5.
The topography of the event-related potential distance effect in normalized amplitude maps. The topography of Distance 5 minus Distance 1 difference potentials is shown in the numerical and physical tasks. White dots denote electrodes with significant distance effects (p < 0.025) between 140–180, 180–240 and 240–320 ms.

