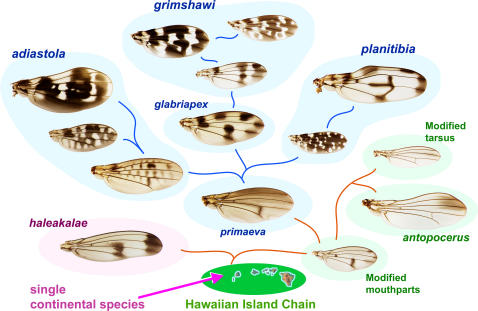
Figure 1. Overview of relationships among major species groups and picture wing subgroups.
Schematic based on chromosomal inversions, DNA sequence data, and morphology [1], [4], [40], [41]. Arrow indicates the proposed single introduction of Drosophila to an island west of Kauai. Blue backgrounds, picture wing subgroups; green backgrounds, modified mouthparts, modified tarsus, and antopocerus groups; pink background, haleakalae/fungus feeder group. Lines schematically indicate consensus phylogenetic relationships. Examples of increasing pattern complexity in the adiastola and grimshawi subgroups are shown. See Figs. 2– 7 for species names. Hawaii map courtesy of geology.com and mapresources.com.

