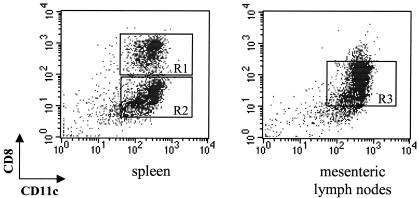
FIG. 2.
Definition of DC subpopulations from spleen and MLNs. Dot plots show the CD8-versus-CD11c profile of SPDCs and MLNDCs. CD8+ and CD8− DC subpopulations can be defined (R1 and R2) in the spleen. In the MLNs an additional CD8int DC subset exists (R3). These data are representative of four experiments with similar results.

