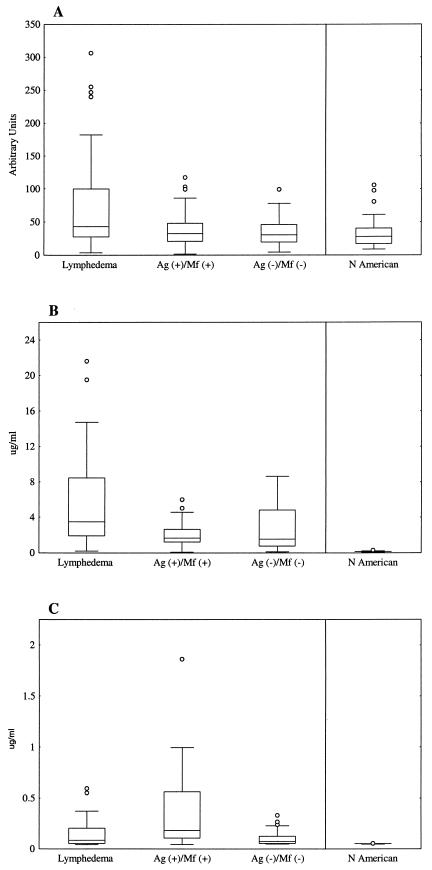
FIG.2.
Anti-WSP IgG levels are associated with the presence of lymphedema. Box and whisker plots show anti-WSP IgG (A), antifilarial IgG1 (B), and antifilarial IgG4 (C) antibody data from women in this study and North Americans. Horizontal lines represent the 25th, 50th, and 75th percentiles of anti-WSP IgG responses, given in arbitrary units, and antifilarial responses, given in micrograms per milliliter. Vertical lines represent the nonoutlier minimum and maximum responses for each group, and circles represent outliers.

