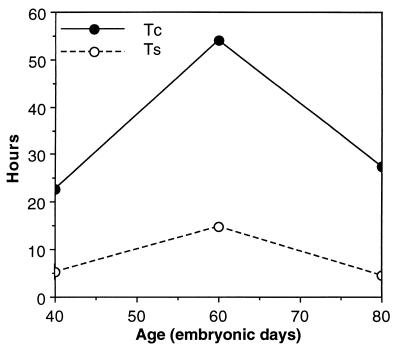
Figure 3.
Developmental profile of the lengths of the cell cycle (Tc) and S phase (Ts) during cortical neurogenesis in monkey VZ. The values of Tc and Ts at each age were calculated from the slope and y intercept, respectively, of the least-squares regression lines in Fig. 2. The height of the open circles indicates Ts, and the distance between the open and filled circles at each age indicates the combined lengths of G1, G2, and M.

