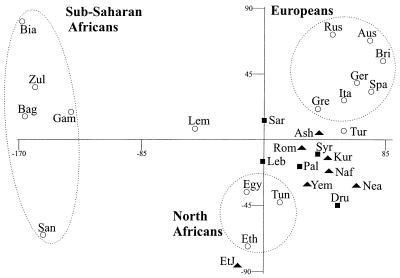
Figure 2.
MDS plot of populations based on Y-chromosome haplotype data. MDS was performed on a matrix of Chord values estimated on the basis of the frequencies of 18 Y-chromosome haplotypes in 29 populations. The three-letter population codes are defined in Subjects and Methods. Solid triangles represent Jewish populations, solid squares represent Middle Eastern populations, and open circles represent all other populations.

