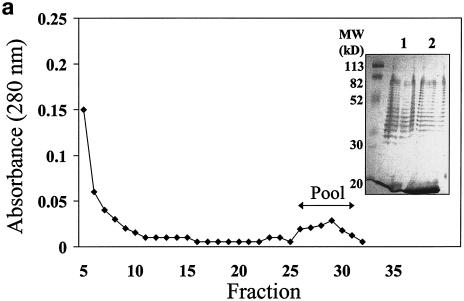
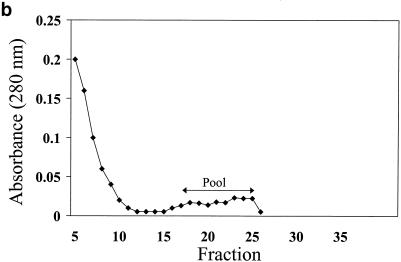
FIG. 2.
Elution curves from affinity chromatography. The OMC of A. actinomycetemcomitans IDH781 was isolated as described in Materials and Methods and applied to a control column (a) to eliminate the nonspecific binding. The flowthrough fraction was applied to the anti-serotype d column (b), and the elution fractions from the columns were pooled as indicated by the arrows. The inset in panel a shows silver staining of the OMC applied to the control column (lane 1) and of the flowthrough fraction from the control column applied to the anti-serotype d column (lane 2).


