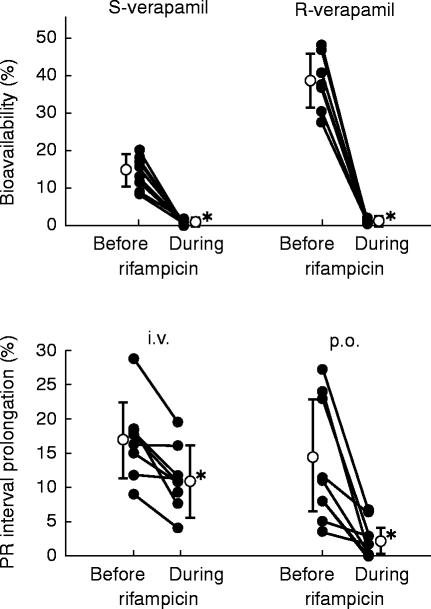
Figure 3.
Bioavailability of S- and R-verapamil (10 mg d7-S/R-verapamil i.v., 120 mg d0-S/R-verapamil p.o.) and maximum PR interval prolongation (i.v.: 0–2 h, p.o.: 2–26 h) in the older subjects before and during treatment with rifampicin. Individual (•) and mean data (○,±s.d.) are shown. (*P<0.01 before vs during rifampicin)

