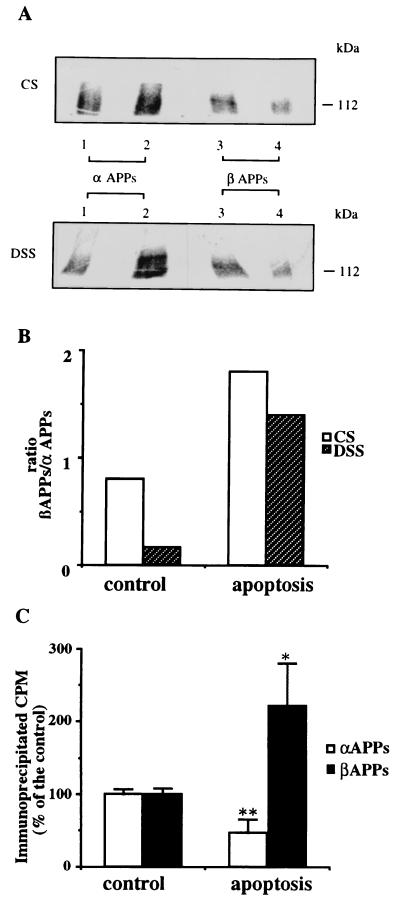
Figure 4.
Increase of β-APPs and decrease of α-APPs in apoptotic secretion. Cells were labeled and apoptosis was triggered as described in Fig. 2. (A) CS (Upper) and DSS (Lower) media from control (lanes 2 and 4) and apoptotic (lanes 1 and 3) neurons were collected and precipitated first with 6E10 (lanes 1 and 2) and reimmunoprecipitated with 22C11 (lanes 3 and 4). α-APPs (100 kDa), isolated with 6E10, is augmented in control secretions (both CS and DSS) with respect to apoptotic secretions. Conversely, β-APPs (∼100 kDa), revealed by the second immunoprecipitation (see text), is increased in apoptotic secretions compared with controls. (B) Phosphorimaging quantification of the experiment shown in A. Histograms show the increase of the β-APPs/α-APPs ratio in both CS (open bars) and DSS (solid bars) media. (C) Phosphorimaging of DSS medium as described in A. Histograms show the α-APPs decrease and the increase of β-APPs in DSS medium from apoptotic neurons compared with control neurons. ∗, P < 0.02; ∗∗, P < 0.01 (n = 3).

