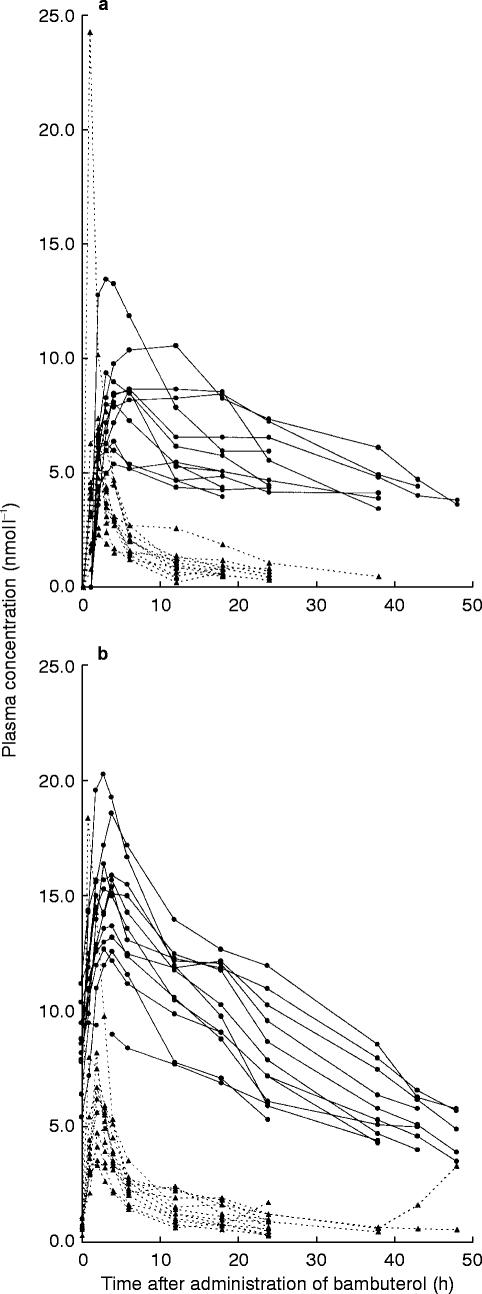
Figure 3.
a) Plasma concentration vs time curves of bambuterol and terbutaline-B after the first oral dose of bambuterol (0.668 μmol kg−1). Symbols and lines as in Figure 2a. b) Plasma concentration vs time curves of bambuterol and terbutaline-B after the last oral dose of bambuterol (0.668 μmol kg−1 day−1). Symbols and lines as in Figure 2a

