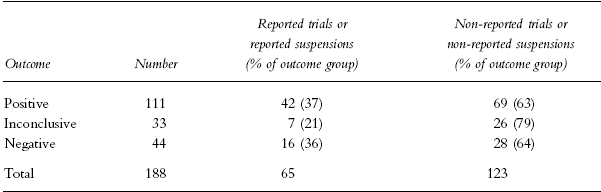
Table 2.
The number (percentage of outcome group) of reported trials or reported suspensions and non-reported trials or non-reported suspensions, by outcome. There was no significant association between trial outcome and submission of final report or reported suspension: χ2=3.19, df=2, P=0.20. Eighty-six trials not resulting in any outcome are excluded.