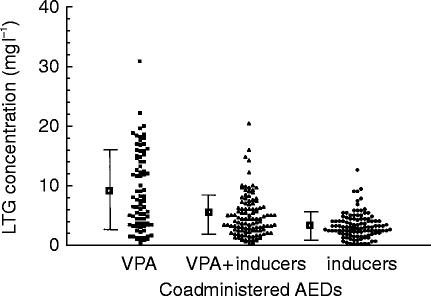
Figure 1.
Distribution of individual LTG concentrations (mg l−1) of patients included in the survey. Data have been divided according to the other AED therapy the patients were prescribed, being LTG plus VPA (n = 74), or LTG plus VPA and inducers (n = 91), LTG plus inducers (CBZ and/or PHT) (n = 89). The mean (±s.d.) has been included for comparison.

