Figure 1.

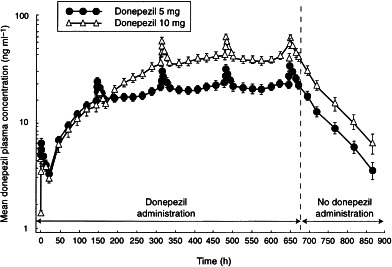
Mean (±SE) plasma concentration–time curves for 5 mg and 10 mg donepezil over the course of the 37-day study. Full pharmacokinetic profiles were undertaken on days 1, 7, 14, 21 and 28. All other time-points represent trough levels.

Mean (±SE) plasma concentration–time curves for 5 mg and 10 mg donepezil over the course of the 37-day study. Full pharmacokinetic profiles were undertaken on days 1, 7, 14, 21 and 28. All other time-points represent trough levels.