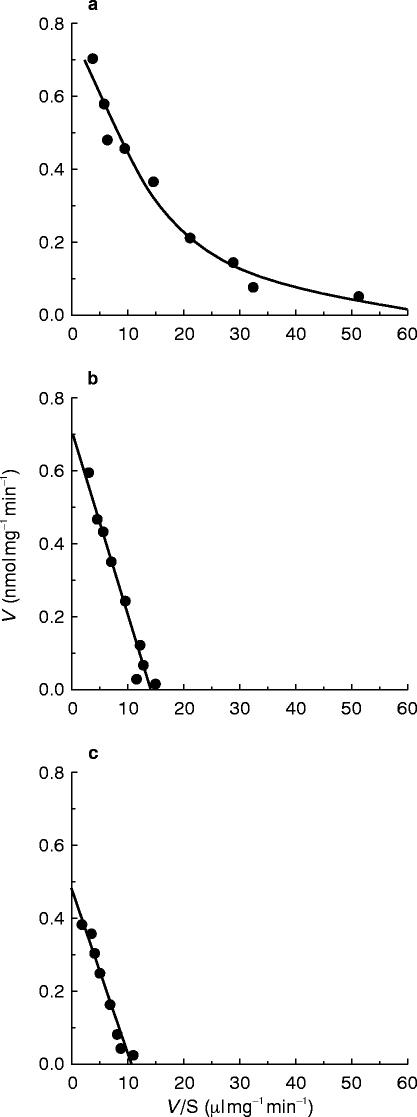
Figure 3.
Representative Eadie-Hofstee plots for phenacetin O-deethylation in the absence (a) or presence of mexiletine (b) and propafenone (c) in human liver microsomes (HL-34). The solid line drawn in (a) is the computer-generated curve of best fit for a two-enzyme kinetic model, while the lines in b) and c) drawn indicate the best fit for a one-enzyme kinetic model.

