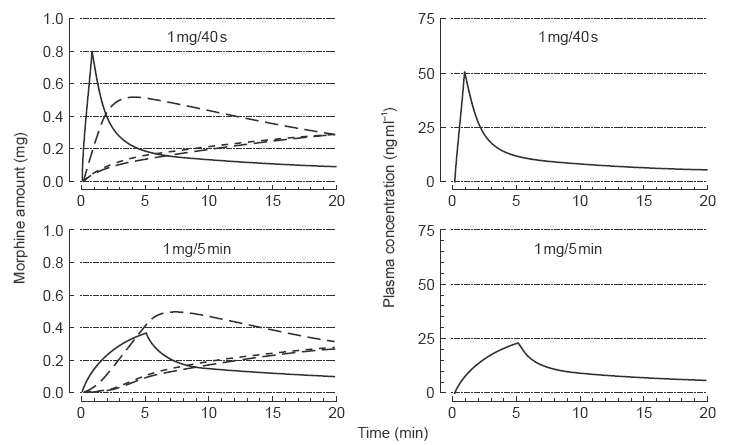
Figure 1.

Pharmacokinetic modelling of morphine sulphate delivered as 1 mg over 40 s (upper panels) and over 5 min (lower panels). Left panels show amounts of morphine in the various compartments of the three compartment open mamillary model; right panels show concentrations of morphine in the plasma-containing central compartment. [The parameters used for the simulations were Vc=16l; ke=0.08 min−1; k12=0.5 min−1; k21=0.2 min−1; k13=0.09 min−1; k31=0.008 min−1; Vss=236 l; CL=1.28 l min−1].
