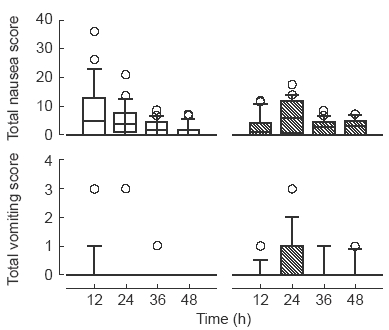
Figure 3.

Box and whisker plots showing total nausea scores (upper panels) and total vomiting scores (lower panels). Patients received morphine sulphate by intravenous PCA with 1 mg incremental doses delivered either over 40 s (left panels, □) or 5 min (right panels, ). Data are shown as median with boxes of 25 and 75 percentiles, whiskers of 10 and 90 percentiles and data (circles) outlying these, for 12 h time segments.
