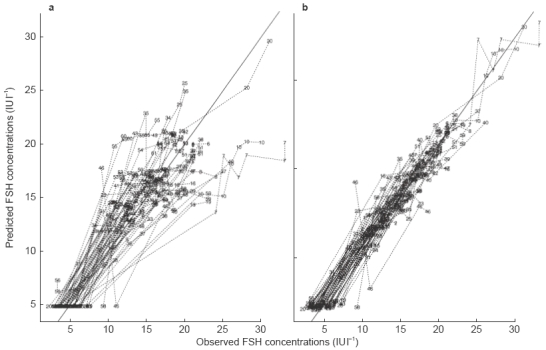
Figure 4.

Observed vs model predicted serum FSH concentrations after i.m. administration of u-hFSH. The left hand panel (a) shows the population predicted serum FSH concentrations and the right hand panel (b) shows the individually predicted serum FSH concentrations.
