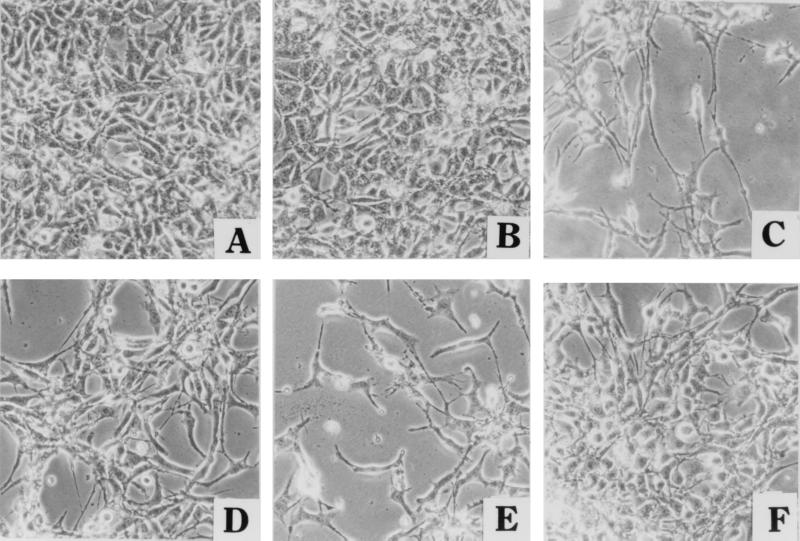
Figure 1.
Photomicrographs of 1RB3AN27 cells. Control undifferentiated cells showed cells of various sizes (A). Negative control was undifferentiated cells treated with solvent alone (B). Cells treated with 2 mm dbcAMP showed areas with high levels of differentiation (C) and areas with minimal levels of differentiation (D). Cells treated by a combination of 2 mM dbcAMP and DHEA at 60 μg/ml showed areas of high levels of differentiation (E) and areas of minimal differentiation (F), where most of the cells appear large and round. (×200.)

