
Figure 13.
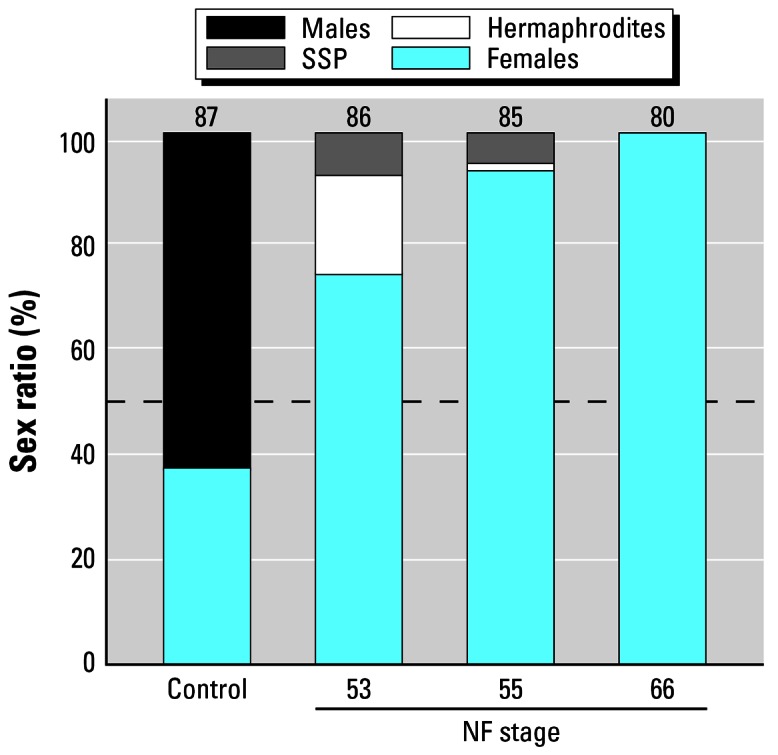
Frequency of males, females, animals with SSP, and hermaphrodites in animals treated for s7, 14, or 49 days with 100 μg/L E2. X-axis is categorical. Control bar shows the control sex ratio. NF stages below the bars indicate the stage at which E2 exposure was terminated. All E2 exposures began at NF stage 50 (Figure 2). Numbers above bars are samples sizes and represent the number surviving to metamorphosis (of 90). Dashed line indicates 50%.