Figure 1.
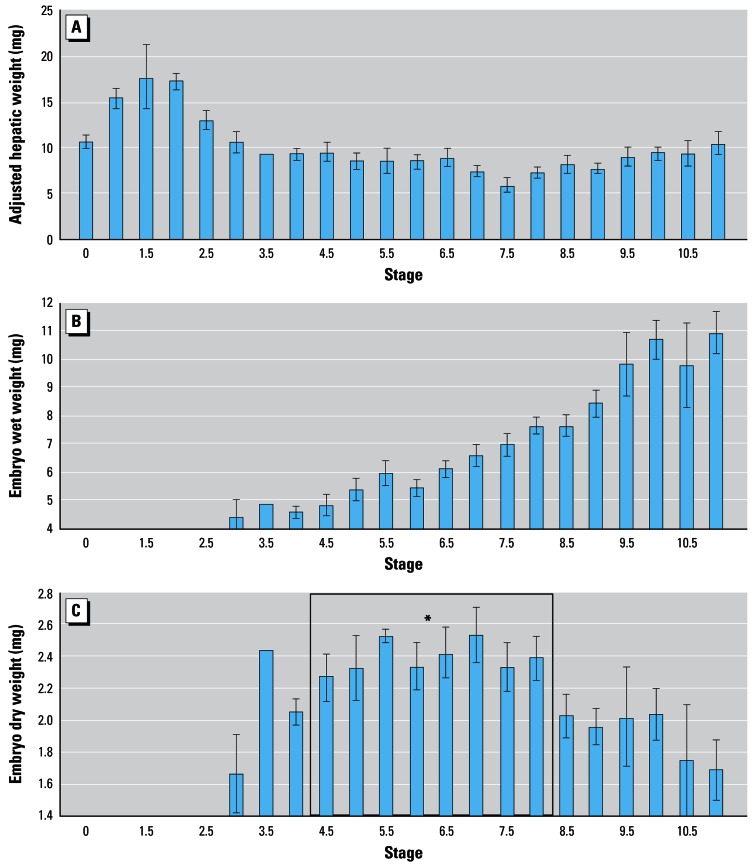
(A) Mean maternal hepatic weight, adjusted for body weight; (B) embryo wet weight; and (C) embryo dry weight plotted by embryonic stage [stages based on Hayne (1995)]. Graphs represent data pooled from all eight springs. Data at stage 3.5 were limited to a single female. Embryo weights represent the sum of the embryo and yolk sac. We did not obtain oocyte/embryo weight data at stages younger than 3 because those oocytes are small, variable in size, and possibly unfertilized. Error bars indicate ± 1 SE.
*The collective mean dry weight of embryos between stages 4.5 and 8 (enclosed in box on graph) was significantly greater than the collective mean dry weights of embryos either younger or older (ANOVA: Scheffe’s post-hoc test, p < 0.05).

