Figure 5.

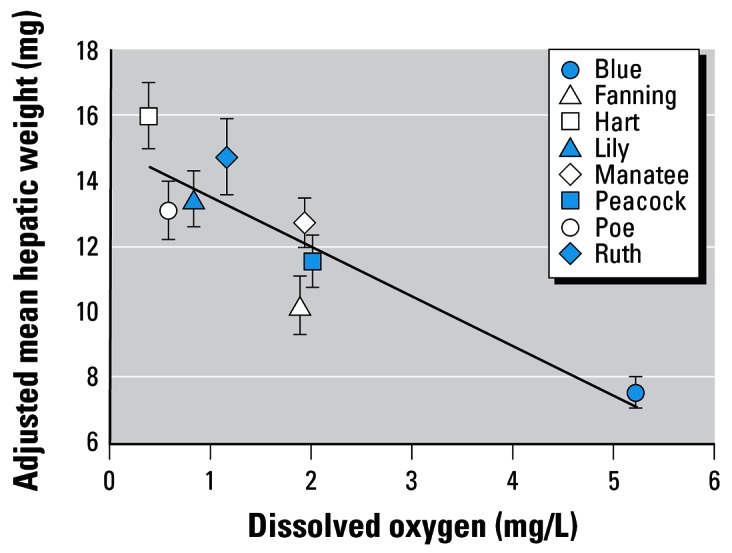
Mean hepatic weight, adjusted for body weight, for females captured in Florida springs with varying dissolved oxygen concentrations. Graph shows adjusted mean ± 1 SE. r2 = 0.85, p = 0.001.

Mean hepatic weight, adjusted for body weight, for females captured in Florida springs with varying dissolved oxygen concentrations. Graph shows adjusted mean ± 1 SE. r2 = 0.85, p = 0.001.