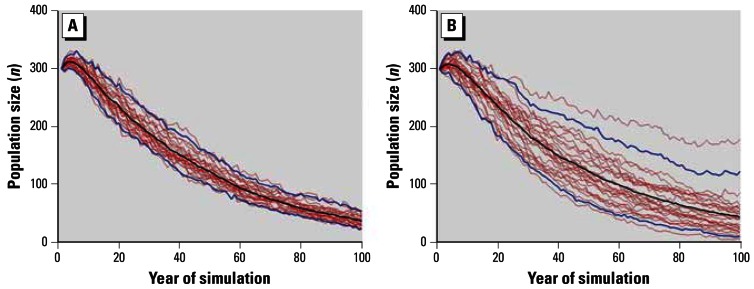
Figure 3.
(A) Twenty-five model simulations (red lines) showing the negative potential population growth over 100 years for the Sarasota bottlenose dolphin population using current estimates for vital rates, PCB accumulation rate (2.96 mg/kg/year), and potential effect of maternal PCB levels on calf survival. (B) Same as A but incorporating uncertainty into the effect of maternal PCB levels on calf survival. Black line connects the mean of the population size for each year, and blue lines connect the 95% CI of the population size for each year.

