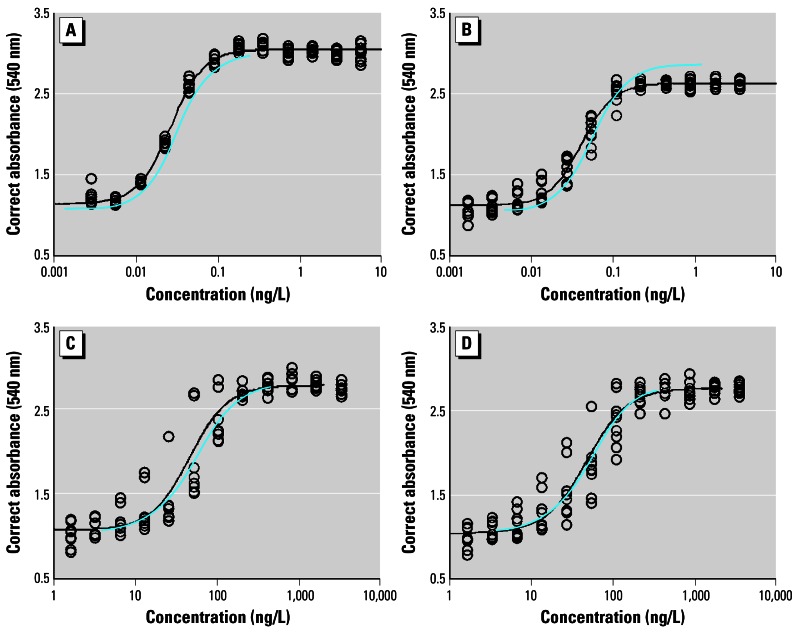
Figure 2.
Concentration–response curves for binary mixtures of E2 and EE2 (A), E2 and E1 (B), E2 and NP (C), and E1 and NP (D) obtained in a recombinant yeast estrogen screen. (○) Represents individual responses at each concentration. (—) Regression line showing the observed mixture response and is based on the results of five in vitro assays in which each chemical mixture was tested in duplicate. (
 ) Regression line showing the predicted response for each mixture based on the concentration–response curves in Figure 1 for each individual chemical. All lines were calculated using a four-parameter logit regression model.

