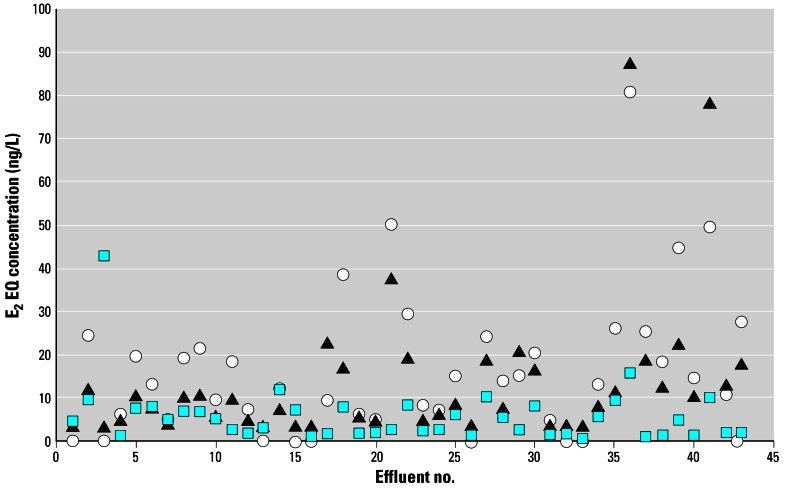
Figure 3.
Comparison of calculated and measured E2 EQs determined for final WwTW effluents sampled from 43 locations across England and Wales. (
 ) Represents the measured E2 EQs in the recombinant yeast screen. (○, ▵) Represent the predicted E2 EQs calculated based on the measured concentrations of the four target estrogenic chemicals in the individual effluents and their relative estrogenic potencies in the recombinant yeast screen (○) and for the induction of VTG in juvenile rainbow trout (▴). Both the measured and predicted responses are based on results from two sampling occasions for each effluent.

