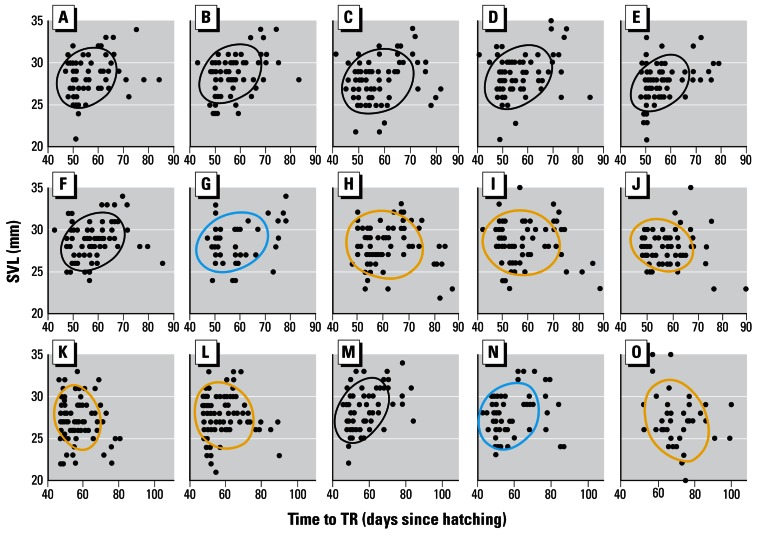
Figure 5.
Correlational analysis of time to complete TR and SVL. Results are shown for single pesticides (0.1 ppb) in A–J and for mixtures (K–O). For the x-axis, the scales for A–J are identical, but note the difference in scale for the mixtures as a result of the delay in metamorphosis in the animals treated with the nine-compound mixture (O). Results are shown for ethanol (A), alachlor (B), cyfluthrin (C), nicosulfuron (D), tebupirimphos (E), S-metolachlor (F), metalaxyl (G), propiconizole (H), λ-cyhalothrin (I), atrazine (J), 0.1 ppb atrazine + S-metolachlor (K), 10 ppb atrazine + S-metolachlor (L), 0.1 ppb Bicep II Magnum (M), 10 ppb Bicep II Magnum (N), and the nine-compound mixture (O). Ellipses show Gaussian bivariate confidence limits. Ellipses are color-coded: black, a positive and significant correlation; blue, a positive but nonsignificant correlation; yellow, a negative but nonsignificant correlation. Significance (p ≤ 0.05) was determined by Bonferroni probabilities and based on Spearmen rank order correlation coefficients. Sample size (as reported in Table 1) cannot be determined from the number of data points due to overlapping data.

