Abstract
Delineating the mechanisms by which cell-penetrating peptides, such as HIV-Tat peptide, oligoarginines and penetratin, gain access to cells has recently received intense scrutiny. Heightened interest in these entities stems from their ability to enhance cellular delivery of associated macromolecules, such as genes and proteins, suggesting that they may have widespread applications as drug-delivery vectors. Proposed uptake mechanisms include energy-independent plasma membrane translocation and energy-dependent vesicular uptake and internalization through endocytic pathways. In the present study, we investigated the effects of temperature, peptide concentration and plasma membrane cholesterol levels on the uptake of a model cell-penetrating peptide, L-octa-arginine (L-R8) and its D-enantiomer (D-R8) in CD34+ leukaemia cells. We found that, at 4–12 °C, L-R8 uniformly labels the cytoplasm and nucleus, but in cells incubated with D-R8 there is additional labelling of the nucleolus which is still prominent at 30 °C incubations. At temperatures between 12 and 30 °C, the peptides are also localized to endocytic vesicles which consequently appear as the only labelled structures in cells incubated at 37 °C. Small increases in the extracellular peptide concentration in 37 °C incubations result in a dramatic increase in the fraction of the peptide that is localized to the cytosol and promoted the binding of D-R8 to the nucleolus. Enhanced labelling of the cytosol, nucleus and nucleolus was also achieved by extraction of plasma membrane cholesterol with methyl-β-cyclodextrin. The data argue for two, temperature-dependent, uptake mechanism for these peptides and for the existence of a threshold concentration for endocytic uptake that when exceeded promotes direct translocation across the plasma membrane.
Keywords: cell-penetrating peptide, endocytosis, fluorescence microscopy, KG1a cell line, leukaemia, octa-arginine
Abbreviations: CM, complete RPMI 1640 medium; CPP, cell-penetrating peptide; MβCD, methyl-β-cyclodextrin; MTT, 3-(4,5-dimethylthiazol-2-yl)-2,5-diphenyl-2H-tetrazolium bromide; PI, propidium iodide; R8, octa-arginine; SFM, serum-free RPMI 1640 medium; Tf, transferrin
INTRODUCTION
The scientific literature describes an ever-increasing library of peptides that mediate the lysis of biological membranes or have capacities to translocate through these structures in the absence of increasing porosity to other molecules. An example of the former is mellitin, but recently more attention has been focused on CPPs (cell-penetrating peptides), also called protein transduction domains, such as the Tat peptide from the HIV-Tat protein and penetratin from the Drosophila melanogaster homeobox protein Antennapedia [1]. A particular interest in these CPPs derives from their abilities in vitro and in vivo to overcome cellular barriers, such as the plasma membrane, and deliver therapeutic macromolecular cargo, including genes and proteins, into cells [2–5].
A prerequisite to efficient utilization of these peptides as delivery vectors is an enhanced understanding of: (i) their interaction with cell-surface components, such as proteins, carbohydrates and lipids; (ii) their mechanism of uptake, such as endocytosis and direct translocation; and (iii) their intracellular fate, such as delivery to lysosomes, dynamics in the cytosol and delivery to the nucleus. Since the discovery that a number of CPP effects are due to fixation artefacts [6,7], the concept that cellular entry was via direct plasma membrane translocation has been somewhat superseded by models showing that entry is via some form of endocytic route, and that translocation occurs across membranes of the endo/lysosomal system or even the endoplasmic reticulum [7–11]. These studies mostly relate to microscopic and flow-cytometric analysis of the peptides as fluorescent conjugates; their attachment to larger cargo will undoubtedly affect their interactions with cells and their translocation capacities [12,13].
Studies from our laboratories and others, using oligoarginine (R7–R9) and HIV-Tat peptides, have shown, however, that, despite the use of stringent methods to remove plasma-membrane-associated peptides with trypsin and heparin, a significant fraction enters cells and nucleus at 4 °C [11,12,14,15]. Uptake of fluorescent HIV-Tat and R8 (octa-arginine) peptides in the non-adherent leukaemic KG1a cell line was not inhibited by placing the cells on ice, but the labelling was diffusely localized throughout the cells compared with only vesicular labelling at 37 °C [11]. Similar observations have been demonstrated in a number of adherent cell lines [12,14,15]. Other studies in HUVECs (human umbilical vein endothelial cells) and macrophages show that 4 °C incubations inhibited uptake by ∼75% compared with incubations performed at 37 °C [10], and claims also exist for no uptake at 4 °C [9]. Although there is disparity over the extent of cellular association at 4 °C, there is general uniformity with respect to the fact that a significant fraction enters cells in the absence of endocytic mechanisms. Recent data also suggest that R8 was able to enhance delivery of liposomes at both 37 and 4 °C [16].
Model membrane systems have also been utilized to investigate the translocation capacities of these peptides, and, as expected, this process is dependent on the peptide sequence and the lipid composition of the membranes [17–21]. These studies have allowed for proposals for the mechanism by which the peptides interact with and traverse membrane systems, and favoured models suggest they are driven via a potential difference following membrane destabilization, that they induce the formation of inverted micelles or that they themselves mediate pore formation.
To investigate further the effects of temperature on cellular peptide uptake, we have performed quantitative and qualitative analysis with the model CPP L-R8–Alexa Fluor® 488 and its D-enantiomer in a leukaemic cell line. We found that peptide localization is sensitive to cholesterol sequestration, peptide concentration and the incubation temperature, such that a reduction in endocytosis at low temperatures is paralleled by an increase in peptide translocation through the plasma membrane.
EXPERIMENTAL
Materials
Alexa Fluor® 488–C5–maleimide and Alexa Fluor 488®–Tf (transferrin) were from Invitrogen. DRAQ5 dye was a gift from Biostatus. N-Acetylcysteine and MβCD (methyl-β-cyclodextrin) were purchased from Sigma.
Peptide synthesis
The two peptides used in the present study were generated as previously described by Fmoc (fluoren-9-ylmethoxycarbonyl) solid-phase synthesis and labelled at the C-terminal cysteine using Alexa Fluor® 488–C5–maleimide sodium salt as fluorescent dye [11]. Purification and characterization were achieved by HPLC and MALDI–TOF (matrix-assisted laser-desorption ionization–time-of-flight) MS respectively. The final peptide products were L-R8–Alexa Fluor® 488 containing naturally abundant L-arginine [NH2-(L-Arg)8-Gly-Cys-(Alexa Fluor® 488)-amide] or D-R8–Alexa Fluor® 488 [NH2-(D-Arg)8-Gly-Cys-(Alexa Fluor® 488)-amide].
Cell culture
The haemopoietic cell line KG1a was maintained at confluency of (0.5–2)×106 cells/ml in RPMI 1640 medium supplemented with 10% (v/v) fetal calf serum, 100 IU/ml penicillin and 100 μg/ml streptomycin at 37 °C with 5% CO2 in humidified air. All cell culture reagents were obtained from Invitrogen.
Fluorescence microscopy
KG1a cells (0.5×10⁶) were washed once with CM (complete RPMI 1640 medium) and equilibrated for 15 min in CM set at 4 (ice), 12, 19, 30 and 37 °C. The medium was then replaced with 200 μl of fresh equilibrated CM containing 2–10 μM L- or D-R8–Alexa Fluor® 488 or 100 nM Alexa Fluor® 488–Tf and incubated at these temperatures for 1 h. The cells were washed twice with ice-cold PBS and once with SFM (serum-free RPMI 1640 medium) without Phenol Red, serum or antibiotics (imaging medium), and resuspended in approx. 20 μl of imaging medium. In some experiments, 10 μM DRAQ5 dye was used to label the nucleus, and this was added at room temperature (20 °C) for 3 min before the last washing step.
Finally, 2 μl of the cell suspension was transferred to a well of a ten-well multispot microscope slide (Hendley) that was then layered with a coverslip. Live cells were then immediately analysed by fluorescence microscopy. Wide-field fluorescent images were obtained on a Leica DMIRB inverted fluorescence microscope equipped with a 63× oil-immersion objective and QImaging Retiga 1300 camera. The acquired images were processed with Improvision Openlab 5.0.2 software. Confocal microscopy was performed using a Leica TCS-SP2 RS confocal laser-scanning microscope equipped with an Ar and HeNe laser and a 63× oil-immersion objective. Leica LCS Lite software was used to merge and stack individual confocal sections through the z-axis to generate maximum projection images. Supplementary movies (see http://www.BiochemJ.org/bj/403/bj4030335add.htm) were generated from the z-stacks using NIH (National Institutes of Health) ImageJ 1.36b software.
In one designated experiment, cells were incubated with 2 μM L-R8–Alexa Fluor® 488 for 1 h and, following washing, were fixed in 3% (w/v) paraformaldehyde for 15 min before further washes and analysis by fluorescence microscopy.
Flow cytometry
KG1a cells (0.5×10⁶) were equilibrated and incubated for 1 h with 2 μM L- or D-R8–Alexa Fluor® 488 at different temperatures as described above. Alternatively, cells were washed in ice-cold CM and incubated with 0.25–5 μM L- or D-R8–Alexa Fluor® 488 for 1 h at 4 °C. The cells were washed three times with ice-cold PBS, resuspended in 200 μl of PBS and Alexa Fluor® 488 fluorescence was measured using a Becton Dickinson FACScalibur analyser. In some experiments, following peptide incubation, the cells were washed once with PBS, incubated with 0.25 mg/ml trypsin solution for 5 min at 37 °C, washed once with ice-cold PBS and finally twice with PBS containing 14 μg/ml heparin. Live cells were gated on forward scatter and side scatter, and 10000 viable cells were analysed.
Analysis of binding and uptake of activated and inactivated Alexa Fluor® 488–C5–maleimide
Unconjugated (activated) Alexa Fluor® 488–C5–maleimide was dissolved in methanol to a concentration of 1.78 mM. For inactivation, 375 μl of the solution was incubated at room temperature for 4 h with a 4-fold molar excess of N-acetylcysteine (10 mg/ml in PBS). The solution was then stored at −20 °C until use. For cell studies, KG1a cells (0.5×10⁶) were equilibrated on ice or at 37 °C, washed and incubated further on ice or at 37 °C in CM containing 2 μM activated or inactivated dye. Finally, the cells were washed twice with imaging medium and analysed, as described, by fluorescence microscopy.
Binding and uptake of peptides and Tf by MβCD-treated cells
MβCD was dissolved in PBS to 76 mM and diluted to 5 mM in SFM. KG1a cells (0.5×10⁶) were washed once with SFM, resuspended in 200 μl of SFM containing 5 mM MβCD and incubated under tissue-culture conditions for 30 min. Control cells were treated as above, but in the absence of MβCD. The cells were then washed with SFM and incubated for 1 h at 37 °C with 2 μM L- or D-R8–Alexa Fluor® 488 or 100 nM Alexa Fluor® 488–Tf in SFM. The cells were washed twice with SFM, resuspended in imaging medium and analysed by fluorescence microscopy.
Cell viability studies
KG1a cells (4×10⁴ cells/well in a total volume of 200 μl) were seeded in 96-well plates and incubated with 0–50 μM L- or D-R8–Alexa Fluor® 488 for 24 h under tissue-culture conditions. Cell viability was then assessed using MTT [3-(4,5-dimethylthiazol-2-yl)-2,5-diphenyl-2H-tetrazolium bromide] assays [22]. Briefly, 20 μl of MTT, 5.5 mg/ml in SFM, was added directly to each well, giving a final concentration of 0.5 mg/ml. The cells were then incubated for 4 h under tissue-culture conditions. The plates were centrifuged at 1000 g for 5 min before removing the supernatant and then adding 100 μl of DMSO. The samples were finally incubated at 37 °C for 30 min before quantifying the absorbance at 550 nm.
RESULTS AND DISCUSSION
Comparative analysis of the subcellular distribution of L- and D-R8–Alexa Fluor® 488
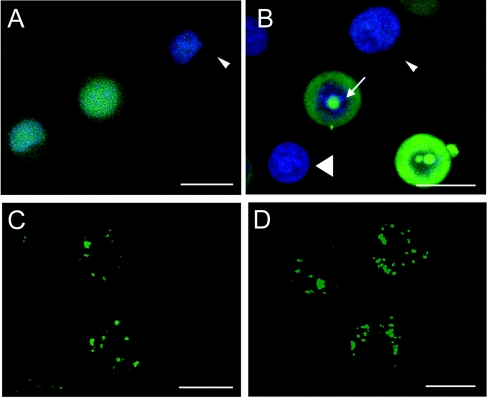
We reported previously on the distinct labelling patterns of L-R8–Alexa Fluor® 488 in the CD34+ leukaemic KG1a cell line when incubations were performed either on ice (referred to as 4 °C) or at 37 °C [11]. As shown in Figure 1(A), confocal microscopy of cells incubated for 1 h at 4 °C with 2 μM L-R8–Alexa Fluor® 488 reveals the peptide to be localized throughout the cell, including the nucleus, and this compares with vesicular labelling only, when identical experiments were performed at 37 °C (Figure 1C). Our ability to label the nucleus of these live cells with the DRAQ5 probe also supports our previous observations showing heterogeneity with respect to the intensity of peptide labelling when peptide incubations are performed at this temperature [11]. To obtain these images, we captured multiple sections through the z-axis and then overlaid the data to create a single merged maximum projection image. Each individual section that contributed to form these merged images (Figure 1) is shown in Supplementary Movies 1–4 at http://www.BiochemJ.org/bj/403/bj4030335add.htm.
Figure 1. Cellular distribution of L- and D-R8–Alexa Fluor® 488 in KG1a cells at 4 and 37 °C.
KG1a cells were incubated for 1 h with 2 μM L- (A, C) or D-R8–Alexa Fluor® 488 (B, D) at either 4 (A, B) or 37 °C (C, D), before analysis by confocal microscopy. Shown are maximum projections of 35 z-stacks (∼500 nm and 2–4 s/section) for each condition. (A) and (B) were also labelled with DRAQ5 dye as described in the Experimental section. Arrows in (B) indicate peptide labelling of nucleolus, the small arrowhead shows a cell showing low peptide labelling, and the large arrowhead shows a cell with undetectable levels of peptide fluorescence. Scale bars, 10 μm. Supplementary Movies 1–4 at http://www.BiochemJ.org/bj/403/bj4030335add.htm display the contribution of each individual stack to the overall fluorescence.
We performed identical experiments with the D-enantiomer of R8, and, similar to the L-form, the peptide localizes to vesicles at 37 °C (Figure 1D and Supplementary Movie 4). When the cells were incubated with D-R8–Alexa Fluor® 488 at 4 °C, we observed diffuse labelling that was less apparent in the nucleus, but much more prominent in the nucleolus (Figure 1B). This is especially noticeable in the accompanying movie (Supplementary Movie 2) that also highlights the heterogeneity of peptide labelling at 4 °C, from high to undetectable.
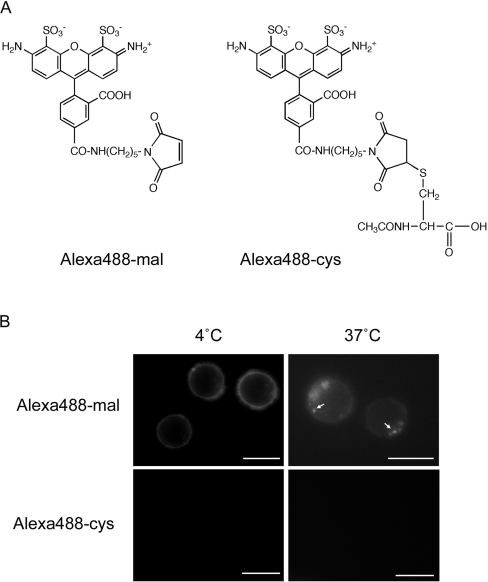
In order to refute the possibility that these effects are caused by extracellular-protease-mediated degradation of the peptide, with resulting release and internalization of free fluorophore, we initially incubated the cells at 4 or 37 °C with the activated Alexa Fluor® 488–C5–maleimide dye that is used to link to the terminal cysteine of the peptide (Figure 2A). At 4 °C, the fluorescence of this compound was confined to the plasma membrane, and, when identical experiments were performed at 37 °C, intracellular vesicles were also labelled (Figure 2B). However, compared with experiments performed with the equivalent concentrations of L-R8–Alexa Fluor® 488 (Figure 1C), much higher exposure times were required to observe these structures. This suggested that, at both temperatures, the activated dye was conjugating to plasma membrane thiol groups and that these conjugates remained on this structure in the absence of endocytosis at 4 °C, but were internalized at 37 °C. We therefore inactivated the maleimide functional group with N-acetylcysteine and observed that even the relatively high exposure times utilized to see the activated dye at 37 °C were not sufficient to label the cells at either temperature (Figure 2B). Thus the fluorescence observed in Figure 1 was a product of R8-mediated delivery to endosomes at 37 °C or to the cytosol, nucleus and nucleolus at 4 °C. We performed identical experiments with a control peptide NH2-(Gly-Ser)4-Gly-Cys-(Alexa Fluor® 488)-amide and, at 2 μM, this was undetectable in cells using fluorescence microscopy (results not shown).
Figure 2. Cellular distribution of activated and inactivated Alexa Fluor® 488–C5–maleimide.
(A) Chemical structures of activated (Alexa488-mal) and inactivated Alexa Fluor® 488–C5–maleimide (Alexa488-cys), following its conjugation to N-acetylcysteine. (B) Cellular distribution of Alexa488-mal and Alexa488-cys. KG1a cells were incubated with 2 μM label for 1 h at 4 or 37 °C before washing and analysis by fluorescence microscopy. Arrows depict vesicular labelling that was only observed with Alexa488-mal at 37 °C. Scale bars, 10 μm.
Effects of temperature on subcellular distribution and cellular fluorescence profiles for L- and D-R8–Alexa Fluor® 488
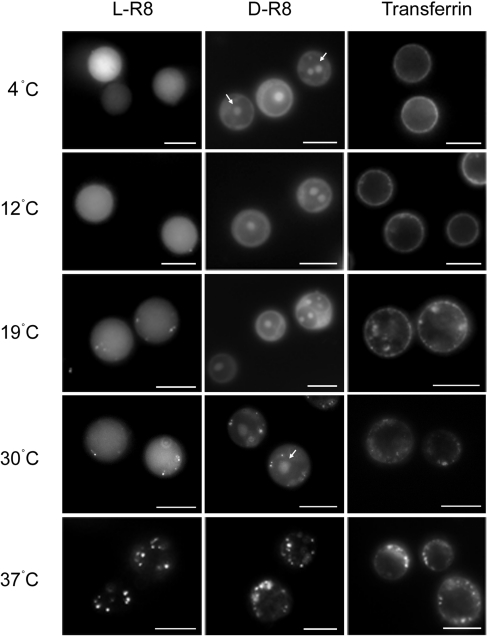
Similar microscopy experiments were then performed with L- and D-R8–Alexa Fluor® 488 at temperatures between 4 and 37 °C. Figure 3 shows that L-R8–Alexa Fluor® 488 diffusely labels the entire cell when incubations were performed at ≤19 °C, but, at higher temperatures up to 30 °C, the diffuse fluorescence is accompanied by vesicular labelling. In cells incubated with the D-R8 peptide, there was similar but additional nucleolar labelling at all temperatures up to 30 °C; at 37 °C, cellular labelling of both peptides was confined to vesicular structures.
Figure 3. Temperature-dependent cellular distribution of R8–Alexa Fluor® 488 peptides and Alexa Fluor® 488–Tf.
KG1a cells were incubated at various temperatures between 4 and 37 °C for 1 h with 2 μM L- or D-R8–Alexa Fluor® 488 or 100 nM Alexa Fluor® 488–Tf before washing and analysis by fluorescence microscopy. Arrows depict labelling of the nucleolus that is unique to D-R8–Alexa Fluor® 488 at up to 30 °C. Scale bars, 10 μm.
We also performed the same experiments with Alexa Fluor® 488–Tf, which, at 4 °C, is expected only to bind the Tf receptor at the plasma membrane, but not to be internalized, and, at higher temperatures, will be endocytosed into clathrin-coated vesicles and endosomes [23,24]. As expected, this protein labelled only the plasma membrane at ≤12 °C, but, at higher temperatures, plasma membrane labelling was accompanied by vesicular labelling that increased in intensity as the temperature was increased to 37 °C. Thus these R8-based peptides behaved quite differently from each other and from Tf when they were incubated with cells at temperatures ≤30 °C. The data also suggest that, unlike Tf, the peptides have at least two independent, but temperature-dependent, uptake mechanisms. Similar differences in cellular distribution of peptides Tat P59W, R7 and R7W were also noted in adherent cells when incubations are performed at 4 °C or 37 °C [12,15], thus suggesting that this differential labelling is not a feature unique to these leukaemic cells.
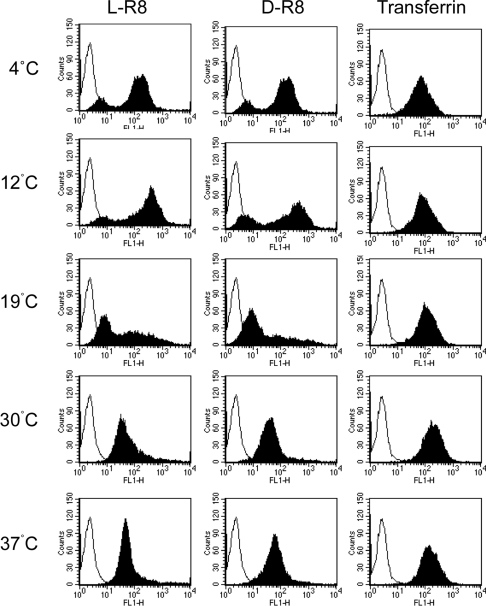
We showed previously using flow cytometry that cellular fluorescence profiles of cells incubated with R8 at 4 °C differ from those incubated at 37 °C [11,14]. We therefore performed flow-cytometric analysis with cells incubated with 2 μM L- and D-R8–Alexa Fluor® 488 at the same selected temperatures between 4 and 37 °C. The results shown in Figure 4 show clear temperature- dependent profiles, but the L- and D-forms gave very similar results. Two peaks were observed for both peptides after 4–12 °C incubations, but, at 19 °C, the lower peak is much more apparent, with a concomitant broadening of the high peak. Only one peak was observed for both peptides when incubated with cells at 30–37 °C.
Figure 4. Temperature-dependent cellular fluorescence profiles for R8–Alexa Fluor® 488 peptides and Alexa Fluor® 488–Tf.
KG1a cells were incubated at various temperatures between 4 and 37 °C for 1 h with 2 μM L- or D-R8–Alexa Fluor® 488 or 100 nM Alexa Fluor® 488–Tf before washing and analysis by flow cytometry. Unfilled peaks represent untreated cells.
Again, Alexa Fluor® 488–Tf was used for comparative analysis, and only one fluorescence peak, with the expected increasing intensity with increasing concentration, was observed at all temperatures (Figure 4). For this ligand, the data allow for easy quantification of cell-associated fluorescence, but this is not the case for quantification of cell-associated L- or D-R8–Alexa Fluor® 488 at <30 °C. This is why the profiles are shown here rather than just the geometric mean values. Interestingly, previous studies in Jurkat T-cells also showed two peaks of fluorescence, but the cells were incubated with a much higher concentration (12.5 μM) of R9 at 25 °C [25]. In conclusion, the data from this section suggest that endocytosis of peptides and Tf occurs at a reasonably uniform rate throughout the cell population, but that differences exist with respect to the capacity of the cells to associate with the peptides at temperatures <37 °C.
Effects of concentration on subcellular distribution and cellular fluorescence profiles for L- and D-R8–Alexa Fluor® 488
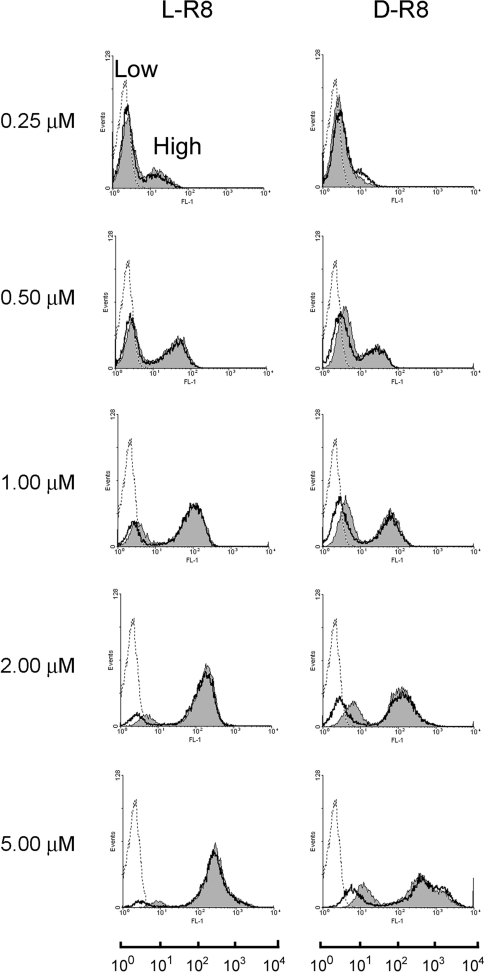
We then investigated whether the cellular fluorescence profiles that we observed at 4 °C were sensitive to the concentration of the peptides in the medium. Cells were incubated with 0.25–5 μM peptide for 1 h before washing and immediate analysis by flow cytometry or, following the peptide incubations, they were treated further with trypsin and washed with heparin solutions. These additional steps have been shown to reduce plasma membrane labelling that contributes significantly to the fluorescence values in adherent cells [7]. The data in Figure 5 show that L- and D-R8–Alexa Fluor® 488 generated two peaks of fluorescence at all concentrations, irrespective of whether the cells were subjected further to trypsin and heparin treatment. These were designated ‘Low’ and ‘High’, and the mean intensity of both generally increased as the peptide concentration was increased; this was accompanied by an increase in the fraction of cells that appeared in the High peak.
Figure 5. Concentration-dependent cellular fluorescence profiles for R8–Alexa Fluor® 488 peptides.
KG1a cells were incubated for 1 h with 0.25–5.0 μM L- or D-R8–Alexa Fluor® 488 at 4 °C. The cells were then washed and either immediately analysed by flow cytometry (filled grey) or were treated further with trypsin and heparin before analysis (unfilled peaks). Broken lines represent untreated cells. In all experiments performed at 4 °C, two peaks of fluorescence of varying intensities were obtained, and were designated Low and High. The geometric mean values of the two designated peaks were calculated for all conditions, and these were combined with results from repeat experiments to generate Table 1.
Trypsinization appeared to have minimal effects on the fluorescent profiles, but, at >1 μM, there was a visible reduction in the geometric mean of the low peaks. To analyse this further, the geometric means of the separate peaks at all studied concentrations were quantified, and the results in Table 1 demonstrate that the fluorescences of the Low peaks are significantly reduced (P<0.05) by trypsin/heparin treatment at concentrations ≥0.5 μM for L-R8 or ≥1 μM for D-R8. However, there was no significant decrease in the fluorescence of the High peak when the peptide concentration was ≥0.5 μM, and, even at 0.25 μM peptide concentration, ≥75% of the fluorescence in the High peak fraction was insensitive to trypsin/heparin treatment.
Table 1. Analysis of fluorescence peaks obtained from incubating cells with increasing concentrations of R8–Alexa Fluor® 488 peptides.
KG1a cells were incubated with 0.25–5.0 μM L- or D-R8–Alexa Fluor® 488 for 1 h at 4 °C. The cells were then washed and either immediately analysed by flow cytometry (PBS) or treated further with trypsin and heparin before analysis (trypsin/heparin). Two peaks of fluorescence were observed and designated Low and High (Figure 5). Shown are the geometric mean values for the Low and High peaks for all depicted concentrations. Results are means±S.D.for two individual experiments performed in duplicate. Statistical analysis for comparing the geometric means of untreated compared with treated fluorescence cells was performed using Student's t test. *P<0.05; decreased relative to PBS control.
| (a) L-R8 | ||||
|---|---|---|---|---|
| Low | High | |||
| Peptide concentration (μM) | PBS | Trypsin/heparin | PBS | Trypsin/heparin |
| 0.25 | 2.76±0.14 | 2.78±0.45 | 17.20±0.45 | 16.10±0.26* |
| 0.50 | 3.12±0.13 | 2.94±0.12 | 39.99±3.27 | 37.87±2.35 |
| 1.00 | 3.89±0.23 | 3.16±0.22* | 98.88±4.60 | 93.64±2.74 |
| 2.00 | 4.78±0.28 | 3.51±0.19* | 175.14±10.61 | 165.90±14.05 |
| 5.00 | 9.44±1.21 | 4.69±0.47* | 357.73±62.42 | 338.55±46.47 |
| (b) D-R8 | ||||
| Low | High | |||
| Peptide concentration (μM) | PBS | Trypsin/heparin | PBS | Trypsin/heparin |
| 0.25 | 3.18±0.12 | 2.94±0.19 | 15.73±1.27 | 12.46±0.57* |
| 0.50 | 4.09±0.18 | 3.07±0.05* | 28.71±5.20 | 30.77±4.56 |
| 1.00 | 4.80±0.51 | 3.17±0.17* | 83.14±19.10 | 76.78±17.98 |
| 2.00 | 6.07±0.17 | 3.82±0.28* | 147.86±16.75 | 155.025±13.61 |
| 5.00 | 11.83±1.69 | 6.18±1.05* | 430.48±63.94 | 521.81±105.11 |
We do not currently have an explanation as to why a particular cell should fall into the Low or High peak population. It is conceivable that the Low peak represents cells with the peptide located within the extracellular matrix of the plasma membrane or even embedded in the lipid bilayer, and that this fraction is only partially sensitive to trypsin and heparin treatment. When cells were incubated for 1 h at 4 °C with L-R8–Alexa Fluor® 488, washed and then incubated for a further 1 h at 4 or 37 °C, there was no significant effect on cellular fluorescence profiles or Low and High peak values (results not shown). The possibility also exists that the loss of the Low peak at higher peptide concentrations is a result of fluorescence quenching and that, for L-R8, fluorescence could be diminished further by proteolysis. This is, however, unlikely, as the intensity of the Low peaks is enhanced with increasing peptide concentrations, but they do not increase in intensity upon trypsinization and heparin washing and neither do they shift to baseline levels. Parallel experiments of peptide association against cell-cycle status may help to define characteristics that predispose the cells to having different capacities to associate with or internalize these peptides.
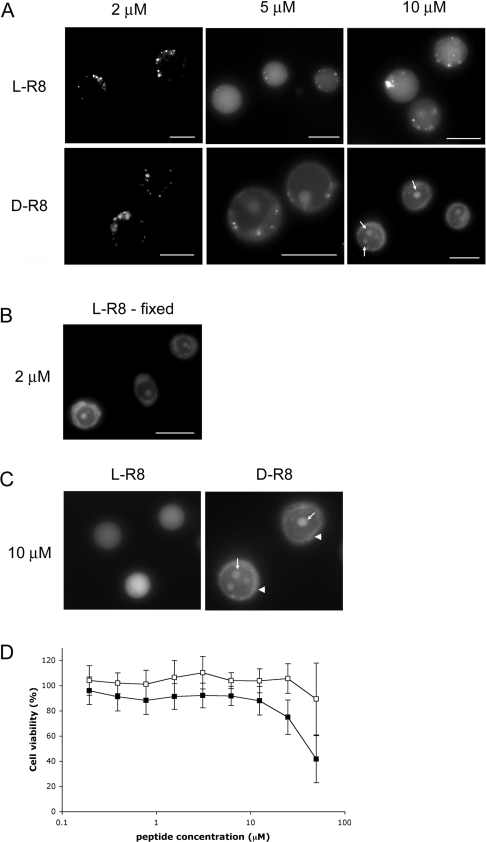
Fluorescence microscopy was then utilized to determine whether increasing the peptide concentration from our standard 1–2 μM affected the subcellular labelling pattern when incubations were performed at 37 °C. Cells were therefore incubated with 2–10 μM peptide for 1 h, washed and then analysed. Figure 6(A) shows that increasing the concentration from 2 to only 5 μM resulted in a dramatic increase in the fraction of the peptide that was localized to the cytosol. Vesicular labelling was still evident at this higher concentration, up to 10 μM, but this was somewhat masked by the strong diffuse labelling. In cells incubated with 10 μM D-R8–Alexa Fluor® 488, the nucleolus was also prominently labelled, but L-R8–Alexa Fluor® 488 failed to label these structures even at these higher concentrations. In all of our experiments, we were unable to observe the presence of L-R8–Alexa Fluor® 488 in the nucleolus, but clear nucleolar labelling was observed when cells, incubated with 2 μM peptide at 4 or 37 °C, were fixed with paraformaldehyde before microscopical analysis (Figure 6B, and results not shown).
Figure 6. Concentration-dependent cellular distribution and toxicity profiles for R8–Alexa Fluor® 488 peptides.
(A) KG1a cells were incubated with 2, 5 or 10 μM L- or D-R8–Alexa Fluor® 488 for 1 h at 37 °C before washing and analysis by fluorescence microscopy. Arrows depict labelling of the nucleolus. Scale bars, 10 μm. (B) KG1a cells were incubated with 2 μM L-R8–Alexa Fluor® 488 for 1 h at 37 °C. After washing, cells were fixed with paraformaldehyde before analysis by fluorescence microscopy. Scale bar, 10 μm. (C) KG1a cells were incubated with 10 μM L- or D-R8–Alexa Fluor® 488 for 10 min at 37 °C before washing and analysis by fluorescence microscopy. Arrows depict labelling of the nucleolus, and arrowheads show faint vesicular labelling. (D) Viability of KG1a cells in the presence of increasing concentrations of R8–Alexa Fluor® 488 peptides. KG1a cells were incubated with 0–50 μM L-R8–Alexa Fluor® 488 (□) or D-R8–Alexa Fluor® 488 (■) for 24 h before performing MTT assays. Cell viability is expressed as the percentage of viable cells relative to untreated controls. Results are means±S.D. for two experiments performed in quadruplicate.
These data strongly suggest that endocytosis as an uptake mechanism, and visible by fluorescence microscopy, is only dominant to a specific peptide concentration. At levels higher than this threshold, the peptide also enters cells by an alternative mechanism. It is highly unlikely that this very strong cytoplasmic labelling at 5–10 μM is caused by endocytosis and then translocation from the endo/lysosomal system, as similar data were obtained when the peptide incubations were reduced to 10 min (Figure 6C). Vesicular labelling in these shorter incubations was, however, less pronounced. Equally, it is unlikely that at low peptide concentrations at 37 °C that translocation from cytosol to endo-somes and lysosomes is significant, as incubations performed at 4 °C in the presence of peptide, followed by 37 °C incubations without peptides, had no effects on the pattern of labelling (results not shown).
At concentrations ≥5 μM, it is conceivable that some of the observed effects were due to peptide-induced membrane damage and cytotoxicity. Parallel experiments were therefore performed in cells incubated with 10 μM L- or D-R8–Alexa Fluor® 488 and PI (propidium iodide), which would only be expected to enter dead or leaky cells. There was no increase in PI-labelled cells under these conditions (results not shown) and longer 24 h cellviability assays demonstrated that D- and L-peptides lacked significant toxicity up to 12.5 μM (Figure 6D).
The majority of studies investigating the uptake mechanisms of CPPs have also utilized peptide concentrations between 0.5 and 10 μM; however, the universality of these effects with respect to other types of cells remains to be determined. There are likely to be different threshold concentrations for different cell lines, as each will have their unique repertoire of plasma membrane lipids, proteins and their associated carbohydrates. These may all affect the degree of peptide association with molecules protruding from the plasma membrane and/or with molecules localized within the bilayer itself.
Effects of cholesterol depletion on subcellular distribution of L- and D-R8–Alexa Fluor® 488
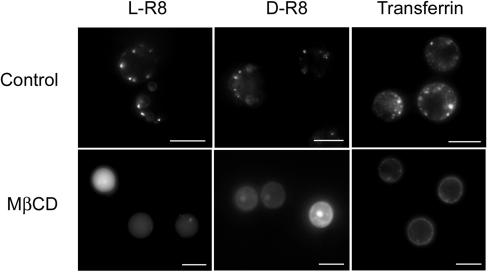
As translocation across membranes was occurring at higher concentrations of peptide, we investigated whether this process could be promoted at lower concentrations by perturbing the organization of the plasma membrane. For this, we depleted plasma membrane cholesterol using a standard method employing the cholesterol-sequestering agent MβCD [26]. Cells were pre-treated with 5 mM MβCD for 30 min before the addition of 2 μM L- or D-R8–Alexa Fluor® 488 for 1 h at 37 °C and immediate analysis by fluorescence microscopy. MβCD-treated cells had strong diffuse labelling of the cytoplasm and nucleus, with very little evidence of vesicular uptake; consistent with our previous experiments, nucleolar labelling was unique to the D-form (Figure 7).
Figure 7. Effects of cholesterol depletion on cellular distribution of R8–Alexa Fluor® 488 peptides and Alexa Fluor® 488–Tf.
KG1a cells were pre-incubated in the absence (Control) or presence (MβCD) of 5 mM MβCD for 30 min at 37 °C before washing and incubation with 2 μM L- or D-R8–Alexa Fluor® 488 or 100 nM Alexa Fluor® 488–Tf for 1 h at 37 °C. The cells were then washed and analysed by fluorescence microscopy. Scale bars, 10 μm.
Very different results were obtained when parallel experiments were performed with Alexa Fluor® 488–Tf, and, in the present study, cholesterol sequestration completely inhibited vesicular uptake and only the plasma membrane was labelled. MβCD was shown previously to significantly inhibit uptake of Tat peptide [9] and penetratin in a number of cell lines [27], suggesting that uptake is occurring via plasma membrane domains called rafts. These are enriched in cholesterol [28], and MβCD is often used to discriminate between uptake via clathrin-coated pits and raft-dependent pathways [29]. Studies in a number of adherent cell lines have, however, shown that Tf internalization is inhibited (40–60%) in MβCD-treated cells [30]. Thus the widespread use of MβCD and other cholesterol-depleting agents should be treated with caution unless control experiments with ligands for clathrin-mediated uptake and other pathways are also investigated. Our experiments raise the interesting possibility that the organization of the plasma membrane into cholesterol-enriched lipid rafts inhibits plasma membrane translocation. They also suggest that the normal site of entry of the peptides, especially at low temperatures, may be the more fluidic regions of the plasma membrane containing less cholesterol.
At 2 μM, D-R8–Alexa Fluor® 488, unlike L-R8–Alexa Fluor® 488, labelled the nucleolus at all temperatures up to 30 °C, but this was also observed when the peptide concentration was increased 2.5-fold or in plasma membrane cholesterol-depleted cells. These are all conditions that showed microscopical evidence for the presence of this peptide in the cytosol, suggesting this is the critical parameter that then allows for sequestration in the nucleolus. At physiological temperatures, proteolysis is likely to contribute much more to L-R8 degradation compared with D-R8, thus the fraction of this peptide that is able to migrate to the nucleus and nucleolus is likely to be reduced [8,31]. However, we also observed the same differences in localization when the cells were pre-cooled to 4 °C and then incubated with the peptides; here, protease effects should be significantly diminished. L-R8–Alexa Fluor® 488 is clearly able to translocate to the nucleus at low temperatures, and nuclear, as opposed to nucleolar, labelling is often more prominent in L-R8–Alexa Fluor® 488-treated cells (Figure 1). It remains to be seen whether nucleolar sequestration of D-R8 is reducing the extent of the fraction localized to the rest of the nucleus. Nucleolar labelling is a common characteristic of cells that have been incubated with CPPs such as oligoarginine and HIV-Tat and then fixed [7,32,33]. Our results in unfixed KG1a cells do, however, support our previous observations of nucleolar labelling of live HeLa cells incubated with the same D-R8 peptide on ice; the extracellular peptide concentration was, however, appreciably higher at 10 μM [14]. An ability to label the nucleolus was also a feature of other CPPs Flu-β-(VRR)4 and Tat-HA2 [13,34], suggesting that these also have a propensity to bind, most probably, to the RNA that is prominent over DNA in these structures.
Conclusions
We have analysed in detail the effects of temperature, concentration and peptide chirality on the cellular dynamics of R8 peptide in KG1a cells. Our results suggest that L- and D-forms of the peptides share several similarities, such as low-temperature translocation, but also differences with respect to labelling the nucleolus. Enhancing the fraction of the peptide that localizes to the cytosol can be achieved by relatively small increases in peptide concentration or by sequestering plasma membrane cholesterol. These processes seem to be specific for the peptides, as we did not observe any parallel increases in membrane permeability or toxicity. It will now be interesting to investigate whether some of these effects are common to more complex CPPs such as HIV-Tat peptide and penetratin, and also to determine further the capacity of R8 at low temperatures to enhance membrane translocation of associated cargo.
Online data
Acknowledgments
M. M. F. is supported by a Marie Curie Host Fellowship for early-stage training in the 6th framework programme of the European Commission. This work was supported in part by Grants-in-Aid for Scientific Research from the Ministry of Education, Culture, Sports, Science and Technology of Japan. T. T. is grateful for support from the JSPS (Japan Society for the Promotion of Science) Research Fellowship for Young Scientists.
References
- 1.Henriques S. T., Melo M. N., Castanho M. A. Cell-penetrating peptides and antimicrobial peptides: how different are they? Biochem. J. 2006;399:1–7. doi: 10.1042/BJ20061100. [DOI] [PMC free article] [PubMed] [Google Scholar]
- 2.Joliot A., Prochiantz A. Transduction peptides: from technology to physiology. Nat. Cell Biol. 2004;6:189–196. doi: 10.1038/ncb0304-189. [DOI] [PubMed] [Google Scholar]
- 3.Snyder E. L., Dowdy S. F. Cell penetrating peptides in drug delivery. Pharm. Res. 2004;21:389–393. doi: 10.1023/B:PHAM.0000019289.61978.f5. [DOI] [PubMed] [Google Scholar]
- 4.Deshayes S., Morris M. C., Divita G., Heitz F. Cell-penetrating peptides: tools for intracellular delivery of therapeutics. Cell. Mol. Life Sci. 2005;62:1839–1849. doi: 10.1007/s00018-005-5109-0. [DOI] [PMC free article] [PubMed] [Google Scholar]
- 5.Wagstaff K. M., Jans D. A. Protein transduction: cell penetrating peptides and their therapeutic applications. Curr. Med. Chem. 2006;13:1371–1387. doi: 10.2174/092986706776872871. [DOI] [PubMed] [Google Scholar]
- 6.Lundberg M., Johansson M. Positively charged DNA-binding proteins cause apparent cell membrane translocation. Biochem. Biophys. Res. Commun. 2002;291:367–371. doi: 10.1006/bbrc.2002.6450. [DOI] [PubMed] [Google Scholar]
- 7.Richard J. P., Melikov K., Vives E., Ramos C., Verbeure B., Gait M. J., Chernomordik L. V., Lebleu B. Cell-penetrating peptides: a reevaluation of the mechanism of cellular uptake. J. Biol. Chem. 2003;278:585–590. doi: 10.1074/jbc.M209548200. [DOI] [PubMed] [Google Scholar]
- 8.Fischer R., Kohler K., Fotin-Mleczek M., Brock R. A stepwise dissection of the intracellular fate of cationic cell-penetrating peptides. J. Biol. Chem. 2004;279:12625–12635. doi: 10.1074/jbc.M311461200. [DOI] [PubMed] [Google Scholar]
- 9.Kaplan I. M., Wadia J. S., Dowdy S. F. Cationic TAT peptide transduction domain enters cells by macropinocytosis. J. Controlled Release. 2005;102:247–253. doi: 10.1016/j.jconrel.2004.10.018. [DOI] [PubMed] [Google Scholar]
- 10.Richard J. P., Melikov K., Brooks H., Prevot P., Lebleu B., Chernomordik L. V. Cellular uptake of unconjugated TAT peptide involves clathrin-dependent endocytosis and heparan sulfate receptors. J. Biol. Chem. 2005;280:15300–15306. doi: 10.1074/jbc.M401604200. [DOI] [PubMed] [Google Scholar]
- 11.Al-Taei S., Penning N. A., Simpson J. C., Futaki S., Takeuchi T., Nakase I., Jones A. T. Intracellular traffic and fate of protein transduction domains HIV-1 TAT peptide and octaarginine: implications for their utilization as drug delivery vectors. Bioconjugate Chem. 2006;17:90–100. doi: 10.1021/bc050274h. [DOI] [PubMed] [Google Scholar]
- 12.Maiolo J. R., Ferrer M., Ottinger E. A. Effects of cargo molecules on the cellular uptake of arginine-rich cell-penetrating peptides. Biochim. Biophys. Acta. 2005;1712:161–172. doi: 10.1016/j.bbamem.2005.04.010. [DOI] [PubMed] [Google Scholar]
- 13.Tunnemann G., Martin R. M., Haupt S., Patsch C., Edenhofer F., Cardoso M. C. Cargo-dependent mode of uptake and bioavailability of TAT-containing proteins and peptides in living cells. FASEB J. 2006;20:1775–1784. doi: 10.1096/fj.05-5523com. [DOI] [PubMed] [Google Scholar]
- 14.Nakase I., Niwa M., Takeuchi T., Sonomura K., Kawabata N., Koike Y., Takehashi M., Tanaka S., Ueda K., Simpson J. C., et al. Cellular uptake of arginine-rich peptides: roles for macropinocytosis and actin rearrangement. Mol. Ther. 2004;10:1011–1022. doi: 10.1016/j.ymthe.2004.08.010. [DOI] [PubMed] [Google Scholar]
- 15.Thoren P. E., Persson D., Isakson P., Goksor M., Onfelt A., Norden B. Uptake of analogs of penetratin, Tat(48–60) and oligoarginine in live cells. Biochem. Biophys. Res. Commun. 2003;307:100–107. doi: 10.1016/s0006-291x(03)01135-5. [DOI] [PubMed] [Google Scholar]
- 16.Iwasa A., Akita H., Khalil I., Kogure K., Futaki S., Harashima H. Cellular uptake and subsequent intracellular trafficking of R8-liposomes introduced at low temperature. Biochim. Biophys. Acta. 2006;1758:713–720. doi: 10.1016/j.bbamem.2006.04.015. [DOI] [PubMed] [Google Scholar]
- 17.Afonin S., Frey A., Bayerl S., Fischer D., Wadhwani P., Weinkauf S., Ulrich A. S. The cell-penetrating peptide TAT(48–60) induces a non-lamellar phase in DMPC membranes. ChemPhysChem. 2006;7:2134–2142. doi: 10.1002/cphc.200600306. [DOI] [PubMed] [Google Scholar]
- 18.Caesar C. E., Esbjorner E. K., Lincoln P., Norden B. Membrane interactions of cell-penetrating peptides probed by tryptophan fluorescence and dichroism techniques: correlations of structure to cellular uptake. Biochemistry. 2006;45:7682–7692. doi: 10.1021/bi052095t. [DOI] [PubMed] [Google Scholar]
- 19.Terrone D., Sang S. L., Roudaia L., Silvius J. R. Penetratin and related cell-penetrating cationic peptides can translocate across lipid bilayers in the presence of a transbilayer potential. Biochemistry. 2003;42:13787–13799. doi: 10.1021/bi035293y. [DOI] [PubMed] [Google Scholar]
- 20.Thoren P. E., Persson D., Lincoln P., Norden B. Membrane destabilizing properties of cell-penetrating peptides. Biophys. Chem. 2005;114:169–179. doi: 10.1016/j.bpc.2004.11.016. [DOI] [PubMed] [Google Scholar]
- 21.Ziegler A., Blatter X. L., Seelig A., Seelig J. Protein transduction domains of HIV-1 and SIV TAT interact with charged lipid vesicles: binding mechanism and thermodynamic analysis. Biochemistry. 2003;42:9185–9194. doi: 10.1021/bi0346805. [DOI] [PubMed] [Google Scholar]
- 22.Mosmann T. Rapid colorimetric assay for cellular growth and survival: application to proliferation and cytotoxicity assays. J. Immunol. Methods. 1983;65:55–63. doi: 10.1016/0022-1759(83)90303-4. [DOI] [PubMed] [Google Scholar]
- 23.Maxfield F. R., McGraw T. E. Endocytic recycling. Nat. Rev. Mol. Cell Biol. 2004;5:121–132. doi: 10.1038/nrm1315. [DOI] [PubMed] [Google Scholar]
- 24.van Dam E. M., Ten Broeke T., Jansen K., Spijkers P., Stoorvogel W. Endocytosed transferrin receptors recycle via distinct dynamin and phosphatidylinositol 3-kinase-dependent pathways. J. Biol. Chem. 2002;277:48876–48883. doi: 10.1074/jbc.M206271200. [DOI] [PubMed] [Google Scholar]
- 25.Mitchell D. J., Kim D. T., Steinman L., Fathman C. G., Rothbard J. B. Polyarginine enters cells more efficiently than other polycationic homopolymers. J. Pept. Res. 2000;56:318–325. doi: 10.1034/j.1399-3011.2000.00723.x. [DOI] [PubMed] [Google Scholar]
- 26.Hao M., Mukherjee S., Sun Y., Maxfield F. R. Effects of cholesterol depletion and increased lipid unsaturation on the properties of endocytic membranes. J. Biol. Chem. 2004;279:14171–14178. doi: 10.1074/jbc.M309793200. [DOI] [PubMed] [Google Scholar]
- 27.Letoha T., Gaal S., Somlai C., Venkei Z., Glavinas H., Kusz E., Duda E., Czajlik A., Petak F., Penke B. Investigation of penetratin peptides. Part 2. In vitro uptake of penetratin and two of its derivatives. J. Pept. Sci. 2005;11:805–811. doi: 10.1002/psc.678. [DOI] [PubMed] [Google Scholar]
- 28.London E. How principles of domain formation in model membranes may explain ambiguities concerning lipid raft formation in cells. Biochim. Biophys. Acta. 2005;1746:203–220. doi: 10.1016/j.bbamcr.2005.09.002. [DOI] [PubMed] [Google Scholar]
- 29.Johannes L., Lamaze C. Clathrin-dependent or not: is it still the question? Traffic. 2002;3:443–451. doi: 10.1034/j.1600-0854.2002.30701.x. [DOI] [PubMed] [Google Scholar]
- 30.Rodal S. K., Skretting G., Garred O., Vilhardt F., van Deurs B., Sandvig K. Extraction of cholesterol with methyl-β-cyclodextrin perturbs formation of clathrin-coated endocytic vesicles. Mol. Biol. Cell. 1999;10:961–974. doi: 10.1091/mbc.10.4.961. [DOI] [PMC free article] [PubMed] [Google Scholar]
- 31.Gammon S. T., Villalobos V. M., Prior J. L., Sharma V., Piwnica-Worms D. Quantitative analysis of permeation peptide complexes labeled with Technetium-99m: chiral and sequence-specific effects on net cell uptake. Bioconjugate Chem. 2003;14:368–376. doi: 10.1021/bc0256291. [DOI] [PubMed] [Google Scholar]
- 32.Futaki S. Oligoarginine vectors for intracellular delivery: design and cellular-uptake mechanisms. Biopolymers. 2006;84:241–249. doi: 10.1002/bip.20421. [DOI] [PubMed] [Google Scholar]
- 33.Silhol M., Tyagi M., Giacca M., Lebleu B., Vives E. Different mechanisms for cellular internalization of the HIV-1 Tat-derived cell penetrating peptide and recombinant proteins fused to Tat. Eur. J. Biochem. 2002;269:494–501. doi: 10.1046/j.0014-2956.2001.02671.x. [DOI] [PubMed] [Google Scholar]
- 34.Potocky T. B., Menon A. K., Gellman S. H. Cytoplasmic and nuclear delivery of a TAT-derived peptide and a β-peptide after endocytic uptake into HeLa cells. J. Biol. Chem. 2003;278:50188–50194. doi: 10.1074/jbc.M308719200. [DOI] [PubMed] [Google Scholar]
Associated Data
This section collects any data citations, data availability statements, or supplementary materials included in this article.


